
Optimizing Market Entry in Emerging Economies: DEA and Neutrosophic-Z MCDM Approach for Chinese Oil and Gas Equipment Manufacturers
Abstract
This study addresses the challenge of optimizing international market entry decisions for Chinese petroleum equipment manufacturers in emerging economies. As global competition intensifies, effective market selection and entry strategy prioritization become crucial for successful expansion. This study employs an innovative integrated approach combining Data Envelopment Analysis (DEA), Malmquist and Neutrosophic Z-number Multi-Criteria Decision Making (MCDM) methods to evaluate market efficiency and prioritize entry strategies. The DEA Malmquist analysis assessed the efficiency and productivity changes of 35 countries from 2013 to 2019, categorizing them into highly efficient, stable, and inefficient markets. Subsequently, the Neutrosophic Z-number MCDM method prioritized specific entry strategies for each market category. Results reveal distinct strategy priorities: highly efficient markets emphasize technological capability and strategic sourcing; stable markets focus on regional consolidation and standardized training; inefficient markets prioritize regulatory compliance and product customization. This integrated approach provides a comprehensive framework for market analysis and strategy formulation, offering valuable insights for Chinese manufacturers in their global expansion efforts. The study contributes to international business strategy literature by demonstrating the effectiveness of combining quantitative efficiency analysis with expert judgment under uncertainty, while also providing practical implications for decision-makers in the petroleum equipment industry.
Keywords:PetroleumEquipmentExpansionData envelopment analysisMulti-criteria decision makingNeutrosophicZ numberChinese
1. Introduction
Energy, particularly the petroleum sector, remains a cornerstone of global economic development, driving industrial progress and shaping international trade dynamics, valued at USD 6,705.68 billion in 2023 and expected to expand to USD 8,917.40 billion by 2031, reflecting a Compound Annual Growth Rate (CAGR) of 3.68%. The petroleum industry is critical not only for energy supply but also for the equipment sector that supports its exploration, production, refinement, and distribution [1]. The global petroleum equipment market, valued at approximately USD 8.1 billion in 2020, is projected to grow at a Compound Annual Growth Rate (CAGR) of 3.2% from 2023 to 2030, underscoring its pivotal role in facilitating upstream, midstream, and downstream operations [2]. Key markets such as the United States, Canada, Saudi Arabia, and other oil-rich nations with substantial reserves and production capacities are prime targets for equipment manufacturers seeking to establish or expand their global presence. These markets demand advanced technologies, including seismic imaging, deep-water drilling systems, and heat transfer solutions, to enable efficient resource extraction and processing in increasingly complex environments.
China, which is often referred to as the "world’s factory" [3], has leveraged its robust industrial base to become a global manufacturing leader, contributing 30.7% of global output by 2022 [4]. This strength has driven the petroleum equipment sector, with firms like Hoffman (Beijing) Engineering Technology Co., Ltd. excelling in plate heat exchangers. Supported by companies like MA Steel and CNOOC, and policies like “Made in China 2025” and the 14th Five-Year Plan, targeting 70% domestic content by 2025 [5], China has enhanced its competitiveness in offshore drilling and FPSO systems [5]. However, in international markets, Chinese firms like Hoffman face fierce competition from established Western and Indian brands such as Kelvion, AIC A-Line, and Process Engineers and Associates, which are renowned for their reliability, superior after-sales support, and compliance with stringent global standards like API and the EU’s ATEX directive [6], [7]. This intense competition in foreign markets has created a “red ocean” environment, characterized by aggressive price wars and shrinking profit margins. The challenge is further exacerbated by geopolitical tensions, particularly the anticipated U.S. trade policies under the Trump administration in 2025, which are expected to impose higher tariffs on Chinese goods [8]. These tariffs could restrict market access and increase costs, making it harder for Chinese manufacturers to compete in established markets like North America and Europe.
Consequently, the pursuit of “blue ocean” opportunities—markets with lower competitive intensity, untapped potential, and growing demand—has become essential for sustaining growth and creating differentiated value [9]. Emerging economies in regions such as the Middle East, Africa, and Southeast Asia are particularly promising due to their rising infrastructure investments, increasing energy needs, and reduced presence of Western incumbents [10], [11]. These regions align with China’s strategic initiatives, such as the Belt and Road Initiative (BRI) and the Asian Infrastructure Investment Bank (AIIB), which aim to enhance regional connectivity and trade [12]. Despite the opportunities, selecting and prioritizing the right emerging markets poses significant challenges. Chinese manufacturers must navigate a TUNA environment— Turbulent, Uncertain, Novel, and Ambiguous—marked by shifting regulations, geopolitical risks, and diverse market-specific variables such as economic conditions, institutional frameworks, and technical requirements [13]. For instance, while emerging economies offer growth potential, they vary significantly in terms of regulatory compliance, infrastructure readiness, and competitive landscapes. The critical question is: which markets should firms like Hoffman prioritize, and how should they tailor their entry strategies to maximize success under global uncertainty?
Research on Chinese manufacturers entering emerging markets in the petroleum equipment industry is limited. While existing studies explore market entry strategies of Western firms [14] and internationalization motives of Chinese state-owned enterprises [15] they largely overlook tailored strategies for Chinese manufacturers in the global TUNA environment. Although potential markets in the Middle East and Africa have been identified for Chinese oil firms, and strategies for oilfield services and logistics have been analyzed [19], there is a lack of specific, adaptable strategies for these diverse regions amid global uncertainties. Moreover, while much research focuses on the broader petroleum sector, the equipment industry—crucial for global competitiveness—receives little attention [14], [16] Studies often highlight challenges faced by Western firms in emerging markets but pay limited attention to barriers encountered by Chinese manufacturers. Similarly, while some research examines the internationalization motives of Chinese national oil companies [17], [18] it rarely addresses how Chinese petroleum equipment manufacturers can strategically select entry modes based on specific market characteristics. Most studies focus on the general petroleum industry or analyze reasons for global expansion failures, with little emphasis on integrating market identification, classification, and strategic decision-making tailored to the petroleum equipment sector [19], [20]. To address the problem, this study develops an integrated, data-driven framework that combines efficiency assessment, machine learning-based market segmentation, and advanced decision-making under uncertainty. The methodology leverages DEA for efficiency evaluation, K-means and DBSCAN—both machine learning techniques—for market clustering, and the Neutrosophic Z-number Multi-Criteria Decision-Making (MCDM) approach for strategy selection.
DEA is a powerful solution for international market selection in export contexts. Multiple studies have applied DEA models to evaluate market efficiency and support decision-making processes [21]. These models incorporate various factors, including import tariffs, logistics costs, ease of doing business, political policy, and economic indicators, to assess potential export destinations, which can provide insights into market efficiency over time. The DEA Malmquist model extends to calculate Decision-Making Unit (DMU) productivity, with DEA window analysis adopting a dynamic approach by treating the same DMU as distinct entities over time, while the moving average method assesses relative efficiency by comparing each DMU against various reference sets [22].
Following the efficiency assessment, market segmentation is critical to formulate tailored entry strategies. This study employs K-means clustering, a popular unsupervised machine learning algorithm, to group emerging economies based on their DEA Malmquist productivity scores into predefined categories: highly efficient, stable, and inefficient. K-means delivers clear, interpretable clusters that highlight structural differences in market efficiency and development levels, enabling firms to align their strategies with organizational priorities [23], [24]. However, K-means assumes uniform data distribution and fixed cluster shapes, which may oversimplify the complex, heterogeneous nature of global markets. To address this limitation, Density-Based Spatial Clustering of Applications with Noise (DBSCAN), another machine learning algorithm, is used as a complementary technique. Unlike K-means, DBSCAN does not require a predefined number of clusters and excels at identifying arbitrarily shaped clusters and outliers that may deviate from typical patterns [25]. By combining K-means for structured segmentation with DBSCAN for validation and outlier detection, this dual-clustering approach ensures both robust market grouping and sensitivity to unconventional opportunities, enhancing the reliability of market selection.
After the market selections, the strategies for market entry are a challenge and involve complex decision-making processes under uncertainty and complexity. Complex decision-making processes will lead to stages of the Neutrosophic Z-numbers MCDM approach. Neutrosophic Sets (NS) signify a substantial advancement in fuzzy set theory, providing a more inclusive framework by integrating truth, indeterminacy, and falsity membership grades, in contrast to conventional fuzzy sets that account for the degree of membership [22]. Providing a more inclusive framework enables NS to manage uncertainty more proficiently than alternative fuzzy methodologies such as Type-2 fuzzy sets, IFSs, and HFSs, which encounter difficulties in addressing indeterminacy and delivering a comprehensive overview [26], [27]. Z-numbers enhance decision-making under uncertainty by incorporating a reliability metric, which is absent in NS alone [28]. The incorporation of Z-numbers with NS in MCDM improves the framework's capacity to handle ambiguous information and its trustworthiness, rendering it especially beneficial in intricate situations when data is missing or inconsistent [29]. This integrated approach—linking Dynamic Efficiency Assessment (DEA-Malmquist), robust market segmentation (K-means & DBSCAN), and Advanced uncertainty Handling (NZN-AHP)—offers a comprehensive and logically structured framework that not only enhances methodological rigor but also aligns closely with the complex, uncertain, and highly heterogeneous nature of international market expansion in the petroleum equipment sector.
This study focuses on answering the following research questions:
I. How can Chinese petroleum equipment manufacturers effectively identify and prioritize emerging markets for entry?
II. What are the most effective strategies for market entry in specific emerging markets, and how should these strategies be selected?
In line with these research questions, the study will pursue the following objectives:
I. To develop a systematic approach for identifying and prioritizing markets for Chinese petroleum equipment manufacturers.
II. To offer strategic recommendations for selecting and entering specific emerging markets based on the evaluation of key factors.
This study makes original contributions in two key areas: the development of an integrated framework for market selection and entry strategy formulation for Chinese petroleum equipment manufacturers and the innovative application of machine learning and Neutrosophic Z-number MCDM techniques. The proposed framework combines DEA Malmquist for dynamic efficiency assessment, K-means and DBSCAN for robust market segmentation, and Neutrosophic Z-number MCDM for advanced strategy selection under uncertainty, offering a systematic, data-driven approach to navigating the complex TUNA environment of global markets. A systematic, data-driven approach enables firms like Hoffman to prioritize high-potential emerging economies and tailor effective entry strategies, bridging the literature gap on Chinese manufacturers’ expansion in the petroleum equipment sector. The novel integration of machine learning-based clustering and Neutrosophic Z-number MCDM not only enhances methodological rigor but also provides a scalable model applicable to other industries facing similar global expansion challenges, contributing to the broader discourse on strategic decision-making in the era of big data and uncertainty.
The rest of the study is divided into five sections. Section 2 provides a literature review, summarizing prior studies and describing the research approach. Section 3 explains the methodology along with the calculation formulas for each technique. Section 4 showcases the results and analysis, and Section 5 interprets the findings and concludes the study.
2. Literature Review
2.1 Globalization Strategies Framework
Ghemawat's Global Strategy Framework, known as the AAA (Adaptation, Aggregation, Arbitrage) model, provides a robust theoretical foundation for analyzing China's petroleum equipment export strategy to emerging markets (Fig. 1) [30]. This model allows for flexible market assessment based on adapting to local differences, leveraging economies of scale, and exploiting market disparities [30]. The concept of "semiglobalization" accurately reflects the petroleum industry's current state, where geopolitical and regional economic factors remain significant [13]. The AAA model balances cost and scale advantages with adaptation to specific market needs [30]. This framework enables a comprehensive analysis of barriers and opportunities in emerging markets, particularly relevant for Chinese companies. It provides a systematic approach to analyzing challenges and proposing strategies for Chinese petroleum equipment firms in a complex global context.
The application of Ghemawat's framework to China's export strategy involves a nuanced approach to each AAA component. The Adaptation strategy focuses on tailoring products and services to specific market requirements, crucial for entering diverse emerging markets with varying regulations and standards. The Aggregation strategy capitalizes on economies of scale through standardization, aligning with "semiglobalization" and leveraging China's manufacturing capabilities globally [13]. The Arbitrage strategy exploits differentials in costs, production, technology, and experience between China and target markets [30], particularly relevant given China's position in global manufacturing and growing capabilities in the petroleum sector. Integrating these strategies allows Chinese companies to balance their competitive advantages with diverse market needs. This framework provides a comprehensive approach to market expansion and a foundation for strategy evaluation and adjustment in a volatile global business environment.
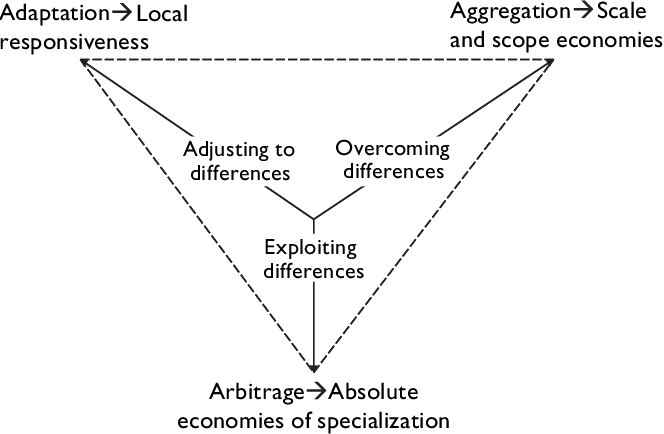
Table 1 outlines specific strategies within each component of the AAA framework, providing a detailed roadmap for Chinese petroleum equipment manufacturers to navigate the complexities of emerging markets effectively:
Table 1. AAA strategies for china's petroleum equipment export to emerging markets.
This table is shown in the PDF version of the article.
schemes tailored to local economic conditions, Coutinho dos developing leasing or installment Santos [32] payment programs for emerging markets.
Localized service S13 Development of market-specific Paul W.
networks service and support networks; forming Beamish [32] partnerships with local petroleum service companies.
Cultural marketing S14 Localization of marketing and sales Chaffey et al. [33] alignment approaches to align with cultural norms; building a digital marketing strategy focused on specialized content and case studies.
Regional-specific S15 Adaptation of product features to suit Porter [34] product modification regional operational practices; customizing products and services for specific market demands.
strategies consolidation manufacturing hubs to serve multiple Verbeke [35] emerging markets.
Core component S22 Standardization of core product Birkinshaw et al. standardization components across markets to achieve [36] economies of scale.
Global brand unification S23 Development of a global brand Steenkamp [37] identity for Chinese petroleum equipment; creating premium product lines to compete with international brands.
Standardized operational S24 Create standardized training programs Becker [38] training for equipment operation and maintenance; develop international training programs for employees.
Centralized R&D S25 Centralization of R&D efforts to Porter [34] optimization leverage innovations across markets; investing in advanced technologies and automation.
Arbitrage Technological capability S31 Utilization of China's advanced Porter [34] strategies leverage technological capabilities; investing in technologies to enhance product quality.
Strategic global sourcing S32 Strategic sourcing of raw materials and Murray et al. [39] components from low-cost regions; building strong local supply chains for optimized costs and delivery times.
Cost-based competitive S33 Leveraging lower manufacturing costs Zeng and pricing in China to offer competitive pricing Williamson [40] and developing cost-efficient solutions for state-owned oil companies.
Knowledge transfer S34 Exploitation of knowledge Kogut and exploitation differentials by offering technology Zander [41] transfer as part of deals.
Diplomatic advantage S35 Capitalizing on China's diplomatic ties Sági and utilization for preferential access, leveraging the Engelberth [42] Belt and Road Initiative for market entry.
2.2 Literature on DEA Method
DEA is a non-parametric technique used to determine the efficiency of decision-making units. The work conducted by Farrell in 1957 marks the origins of the DEA. Farrell's theory of production potential frontier evaluates the operational efficiency and financial success of companies within the same sector by considering factors such as the efficiency of resource allocation and overall technical efficiency [43]. The DEA-Malmquist model is a modified version of the original DEA model [44]. The DEA-based Malmquist productivity index is designed to evaluate productivity alterations throughout a specific period. Malmquist initially proposed the Malmquist index, a quantity index to analyze input consumption [45]. Färe et al. [44] synthesized the concepts of quantifying effectiveness from Farrell by measuring performance from Caves et al. [46]. The Malmquist Productivity Index (MPI) based on DEA is directly derived from the data that is being received and sent out. This index serves as a highly effective tool for quantifying the performance change of DMUs. The method is an invaluable instrument for assessing the efficiency of DMUs. The MPI is computed by integrating the Catch-Up index (CU), which quantifies technical efficiency, and the Frontier-Shift (FS) index, which quantifies technological efficiency. The current investigation uses the Malmquist model to identify potential countries for petroleum equipment companies to enter the market.
The DEA method, particularly in conjunction with the Malmquist index, has been extensively used in previous studies to evaluate the performance and development of countries. Prior studies, such as Färe et al. [44], used the DEA-Malmquist index to evaluate productivity growth and efficiency in industrialized nations, incorporating factors like GDP and technical progress. At the same time, Charnes et al. introduced the DEA framework to measure DMU efficiency, later adapted to assess country-level performance using economic, social, and environmental indicators [47], [48]. Zhu [49] further detailed DEA’s versatility in handling multiple inputs and outputs to evaluate national stability across industries and regions. Building on these works, we apply the DEA method to assess countries’ suitability for petroleum equipment enterprises. The selected inputs and outputs (Table 2) enable a comprehensive evaluation of country stability and development, informing strategic market entry decisions in the petroleum sector.
For a Chinese company exporting oil and gas equipment, the DEA-Malmquist analysis incorporates input variables (Table 2) critical to production capacity, consumption, and business environments. These inputs— such as public debt, tax rates, security index, economic decline, electricity and renewable energy capacity, business startup costs, and tax complexity—directly shape the business environment and production capabilities. High debt or taxes may reduce affordability and profitability, while security and economic stability influence operational viability. Energy capacities reflect industrial support, and business startup costs and tax burdens indicate market accessibility.
Output variables, including oil production, diesel and heating oil consumption, business freedom index, and trade freedom index, reflect a country’s stable and conducive business environment. These outputs highlight success in leveraging oil and gas resources and the degree of commercial freedom, guiding the exporting company’s investment and market selection decisions. The DEA Malmquist Output Orientation (OV) method is chosen over alternatives like OC or OGRS, as it maximizes outputs (e.g., oil production and consumption) without reducing inputs. This approach is critical for developing an efficient market entry strategy, optimizing resource use, and meeting international market demands.
Table 2. Inputs and outputs used in previous relevant studies.
This table is shown in the PDF version of the article.
(I) Government debt as a percent of GDP
(I) Tax rate as a percent of commercial profits (I) Security threats index (0 = low, 10 = high) (I) Economic decline index (0 = low, 10 = high) (I) GDP per capita (current U.S. dollars)
(I) Renewable power capacity (million kilowatts)
(I) Imports of goods and services (billion USD) (I) Number of taxes paid by businesses Output Factors (O) Oil production (thousand barrels per day) (O) Diesel and heating oil consumption (thousand barrels/day) (O) Business freedom index (0-100) (O) Trade freedom index (0-100)
(I) Electricity production capacity (million kilowatts)
(I) Fossil fuels electricity generation (billion kilowatt-hours) (I) Solar electricity generation (billion kilowatt-hours) (I) Cost of starting a business (% of income per capita)
2.3 Literature on Clustering Methods
Clustering is an unsupervised learning technique that groups data based on similarity or distance, aiming to maximize intra-cluster similarity while minimizing inter-cluster differences [50]. It is widely applied in fields such as market segmentation, pattern recognition, and anomaly detection. Common clustering methods include K-means, Fuzzy C-Means (FCM), DBSCAN, and hierarchical clustering, with applications in areas like marine traffic analysis [51], digital library management, and federated learning [52]. However, clustering faces challenges such as sensitivity to initialization and parameter selection, which can lead to suboptimal results. Advanced techniques, such as Quantum Particle Swarm Optimization (QPSO) for FCM, have been developed to improve convergence and stability [25].
K-means, a centroid-based clustering algorithm, partitions data into k clusters by minimizing intra-cluster variance, assuming convex, spherical clusters [53]. Its computational efficiency and scalability make it ideal for large, structured datasets [16]. K-means has been widely used in market analysis [54] and marine traffic studies [55], financial performance evaluation [56], sales potential analysis of BUMDES products [57], logistics optimization [58], and organizational performance analysis [59]. However, its limitations include the need to predefine the number of clusters (k) and sensitivity to outliers, which can skew centroids and reduce clustering accuracy in heterogeneous datasets [60].
DBSCAN, a density-based clustering algorithm, groups data points based on proximity and density, forming clusters of arbitrary shapes without requiring a predefined number of clusters. It is effective at identifying outliers, making it suitable for detecting anomalous markets [61]. DBSCAN defines core points (≥minPts points within ε radius), border points (within ε of a core point), and noise (outliers), with applications in marine traffic pattern extraction [62–64] as well as [65]. However, DBSCAN’s performance depends on careful calibration of ε and minPts, leading to improvements like multiverse optimization [66] and quadtree-based parameter adaptation [67], which increase computational complexity.
In this study, K-means is used to segment 35 emerging economies into three performance-based clusters based on MPI scores, leveraging its efficiency and interpretability for structured market analysis. DBSCAN complements K-means by validating clusters and identifying outliers, ensuring no strategically significant markets are overlooked. This dual approach combines K-means’ structured segmentation with DBSCAN’s ability to detect non-spherical clusters and anomalies, improving the reliability of market prioritization for Chinese oil and gas equipment manufacturers.
2.4 Literature on Neutrosophic Z-Numbers AHP
AHP, developed by Saaty [68], is an MCDM method that structures complex decisions by organizing criteria into a hierarchy, assigning weights through pairwise comparisons, and ranking alternatives based on their relative importance. AHP’s structured, systematic approach makes it highly suitable for the oil and gas sector, where decisions involve multiple conflicting factors such as cost, risk, and market potential, and for prioritizing tasks like market selection and strategy formulation. Its ability to incorporate both quantitative data and expert judgment allows decision-makers to evaluate diverse criteria, such as economic viability, regulatory compliance, and geopolitical risks, which are critical in the volatile oil and gas industry [69], [70]. AHP has been effectively applied in this sector for risk assessment, supply chain optimization, and market prioritization, as well as in broader contexts for selecting optimal markets and strategies [71], [72]. However, conventional AHP struggles with handling uncertainty, subjectivity, and imprecise data prevalent in the TUNA environment of global oil and gas markets. To address this, fuzzy logic was integrated into AHP to manage vagueness, but fuzzy AHP falls short in capturing indeterminacy and assessing the reliability of judgments, which are crucial for robust decision-making in complex, dynamic settings [73–75].
To overcome these limitations, Neutrosophic Set Theory (NST), introduced by Smarandache [76], enhances fuzzy sets by incorporating three independent membership functions—Truth (T), Indeterminacy (I), and Falsity (F)—within the interval [−0, 1+], enabling a comprehensive representation of uncertainty, inconsistency, and contradiction. Single-Valued Neutrosophic Sets (SVNS) further adapt NST for practical applications, such as supply chain management and critical factors in sustainable practice analysis [72], [77], [78]. However, NST alone lacks mechanisms to evaluate the reliability of information. Z-numbers, proposed by Zadeh [28], address this by pairing a fuzzy restriction (A) with a reliability measure (B), enhancing decision-making precision in contexts like system reliability assessments [79]. Integrating NST and Z-numbers into Neutrosophic Z-numbers (NZN) combines multi-dimensional uncertainty modeling with reliability considerations, as demonstrated in cybersecurity and MCDM applications [77], [79], [29]. NZN-AHP is particularly suitable for this study, as it equips Chinese oil and gas equipment manufacturers to prioritize emerging markets and tailor entry strategies in the TUNA environment. By addressing uncertainty, indeterminacy, and reliability, NZN-AHP ensures robust, adaptive decision-making for market selection and strategy prioritization, aligning with the sector’s complex and uncertain dynamics.
Table 3. Related works.
This table is shown in the PDF version of the article.
Assess the risks of oil and gas pipeline AHP Oil and Gas hot work. [81] Identify complexity drivers in supply AHP Oil and Gas chains. [69] Quantify the risks of crude oil storage Improved AHP Oil and Gas tank leaks. [75] Select optimal markets for rolling AHP Power Generation stock manufacturers. [71] Choose locations for market AHP General Business expansion. [82] Evaluate 193 countries for export AHP General Business market viability. [72] Assess business plan feasibility for bus Neutrosophic AHP Tourism tours. [78] Analyze non-traditional security Z-number fuzzy AHP Finance threats to supply chains. [83] Fuzzy AHP with Extended Select optimal logistic hub locations Z-numbers Logistics under uncertainty. [84]
3. Methodology
The research process comprised two distinct phases, as shown in Fig. 2.
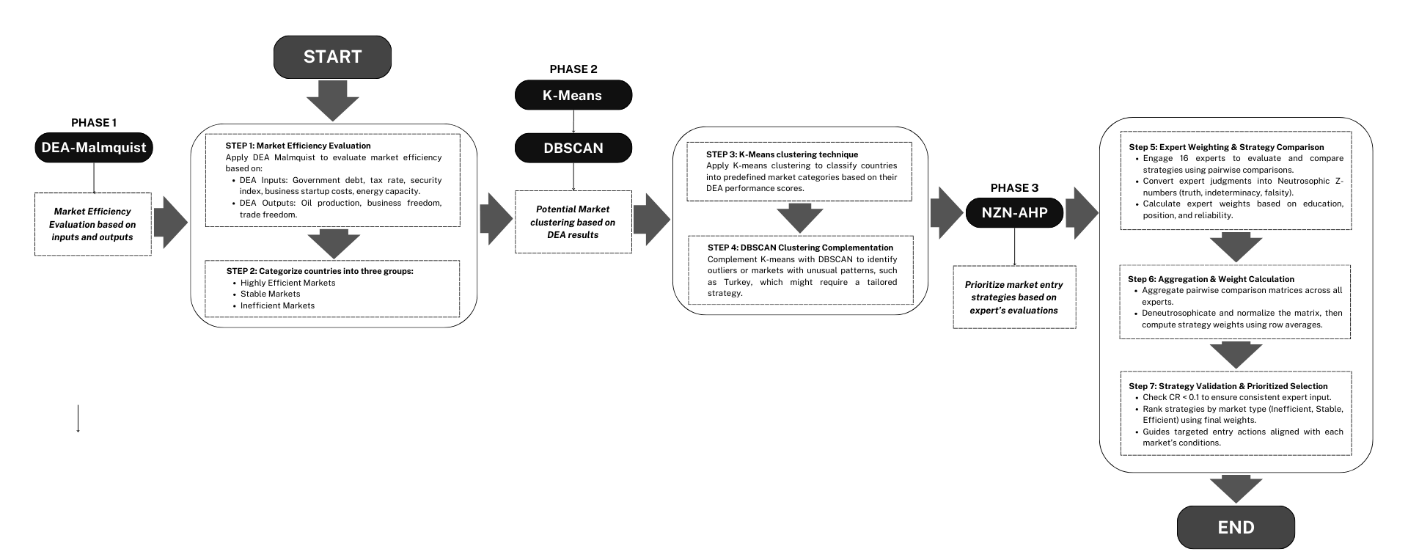
The proposed research framework for prioritizing emerging markets and strategizing entry for Chinese oil and gas equipment manufacturers unfolds in three structured phases. Phase 1: Market Efficiency Assessment involves a comprehensive evaluation using the DEA Malmquist model to analyze the efficiency and productivity dynamics of 35 emerging economies from 2013 to 2019. This phase leverages input factors such as import tariffs, logistics costs, and political-economic indicators to classify markets based on performance metrics. Phase 2: Market Segmentation employs K-means clustering to categorize these economies into three performance-based groups—high, stable, and low efficiency—facilitating structured market prioritization. To enhance robustness, DBSCAN is applied to validate the clusters and identify outliers, ensuring the inclusion of strategically significant markets with unique trajectories. Phase 3: Strategy Prioritization utilizes the NZN-AHP to rank entry strategies for each cluster, integrating truth, indeterminacy, falsity, and reliability metrics to address uncertainties and tailor strategies, such as joint ventures or certifications, to market-specific conditions. This integrated framework, grounded in rigorous quantitative and qualitative methodologies, provides a systematic approach to guide firms like Hoffman in navigating the complexities of the TUNA global environment.
3.1 DEA Malmquist
DEA-Malmquist, proposed by Caves et al. [46], is a tool used to assess the efficiency changes for each DMU over different periods [46]. This study utilized the original MPI model and the extended model by Fare et al. [48] to evaluate the dynamic productivity trends according to the efficiency and technology of the companies. The DEA-Malmquist method examines many categories of inputs and outputs (shown in Table 3) to evaluate the efficiency of DMUs over a certain period of time. The MPI comprises two primary elements: Efficiency Change (EC) and Technological Change (TC). Efficiency change, or CU, reflects the changes in efficiency among the DMUs, while technological change, referred to as FS, illustrates the shifts in the efficiency frontier. By comparing efficiency scores, this method allows the determination of the relative efficiency of logistics companies, thereby assessing and ranking them based on their financial indicators, aiding in making more precise management decisions and strategies. The total factor productivity change from period t to period t+1 is determined by applying Eq. (1).
t t+1 t+1 t+1 t+1 t+1
b0 (e , f ) b0 (e , f )
t+1 (1)
MPIt = √ × .
t t t t+1 t t
b0 (e , f ) b0 (e , f )
t+1 t+1
Between t and t+1, MPIt > 1 demonstrates a significant increase in DMU performance, whereas MPIt = 1 ; MPIt < 1 on the other hand, shows no change in performance and negative growth.
Two components may be multiplied to get the MPI index:
t+1 t+1 t t
MPI(e , f , e , f )
t+1 t+1 t+1 t t (2) ( ) ( t+1 t+1) ( t t) b0 e , f b0 e , f b0 e , f = √ × , = CU × FS.
t t t t+1 t t t+1 t t
b (e , f ) b (e , f ) b (e , f )
0 0 0
In the context of analyzing the productivity of logistics companies based on financial reports, a CU value greater than 1 indicates the company is actively working to reduce the gap and approach ideal efficiency. Alternatively, an FS value assesses the company's overall efficiency improvement or decline, potentially expanding or contracting the frontier and impacting industry-wide efficiency. An increase in the CE value suggests the company is nearing the efficiency frontier, whereas a rise in the FS value indicates innovation and technological advancement.
3.2 Clustering Algorithm
3.2.1 K-means clustering algorithm
K-Means is a straightforward unsupervised learning method employed for clustering tasks. It divides a set of ‘n’ data points into k groups, assigning each point to the cluster with the closest mean value. The primary objective of the K-Means algorithm is to reduce the target function.
The steps for clustering data with the K-Means algorithm are as follows:
Step 1. Split the dataset into K groups and randomly allocate the clusters. This process ensures that each cluster contains a roughly equal number of data points. Random assignment guarantees that every data point has an equal chance of being placed in any cluster, reducing the risk of bias.
Step 2. Measure the distance between each data point and the center of each cluster.
Step 3. Relocate data points that are far from any cluster to the nearest one, while leaving points already near a cluster unchanged.
Step 4. The resulting clusters, including their initial configuration, internal distances, and cohesion, can be heavily influenced by the initial selection of partitions.
3.2.2 DBSCAN clustering algorithm
Simultaneously, DBSCAN, a density-based clustering algorithm, is utilized to identify patterns in the dataset. The preprocessing stage involves standardizing the dataset through feature scaling to enhance the algorithm’s robustness. At its core, DBSCAN focuses on identifying core points, forming clusters, and isolating outliers. By determining core points based on proximity and density, the algorithm autonomously constructs clusters, effectively capturing regions with varying point densities.
The DBSCAN algorithm operates as follows:
Core point identification
I. Parameters: ε (neighborhood radius), min_pts (minimum number of points in a neighborhood).
II. For each data point, xi x_i xi.
III. Count the number of neighboring points within ε distance.
IV. Mark xi x_i xi as a core point if the count ≥ min_pts.
Cluster formation
I. For each core point xi x_i xi.
II. Recursively expand the cluster by adding reachable points within ε distance.
III. Assign each non-core, non-noise point to the cluster of its nearest core point.
IV. Unassigned points are classified as noise or outliers.
V. This structured approach ensures that DBSCAN effectively identifies clusters and outliers based on density, providing a robust framework for spatial data analysis.
3.3 NZN-AHP Method
Zadeh [28] describes a Z-number as a structured pair of fuzzy numbers (A, C), where A represents the fuzzy value associated with an uncertain variable X, and C indicates the reliability of that value. However, this framework fails to account for the intrinsic aspects of indeterminacy and falsity within Z-numbers. To address this limitation and create a more robust model that incorporates truth, indeterminacy, and falsity, the Neutrosophic Z-Number (NZN) has been introduced as an enhanced extension of the original concept. NZN-AHP Model Step 1. Calculate the weight of the expert.
Expert weights will be assessed using NZN numbers, comprising two components: A, representing the degree of evaluation based on the expert's experience and education, and C, indicating the degree of certainty based on the research team's knowledge about the expert. The two NZN numbers representing the expert rating based on years of experience and education will be aggregated using Eq. (7) and converted into a crisp score using Eq. (11). Table 4 outlines the expert-level assessment along with the corresponding linguistic scale [85].
Table 4. Expert rating scale.
This table is shown in the PDF version of the article.
Calculate the evaluation value for k experts, obtaining k values EK: ekj = {ek1, ek2, … ekk}. The weight of expert EW: ewj = {ew1, ew2, … ewk} is calculated as Eq. (3) below:
ekj
ewj = . (3)
∑ ekj
Step 2. Select decision-makers and experts who are considered experts in this field.
The main and sub-criteria for strategy selection for market expansion in emerging markets are collected. Expert opinions are collected using a linguistic scale established by Saaty [68], subsequently converted to NZN. The rating scale and corresponding NZN are presented in Table 4.
Table 5. Linguistic scale set.
This table is shown in the PDF version of the article.
Step 3. Construct Pairwise comparison matrices derived from the relationship between criteria by the decision-makers panel.
Step 4. Application of the aggregation method to aggregate expert opinions into one matrix to form the direct relation matrix.
Step 5. Convert the aggregated pairwise comparison matrices for criteria into deneutrosophic form by applying Eq. (4):
2 + aE1 aR1 − bE1 bR1 − cE1 cR1
s(a ) = , DEF(NZN ) ϵ [0, 1], (4)
ij Z1
where T, I, and F represent truth, indeterminacy, and falsity, respectively. aij denotes the value in the comparison matrix, with i referring to the number of comparisons or criteria under consideration.
Step 6. Normalize the aggregated or average comparison matrix using Eq. (5):
aij
Norm ij = n for j = 1,2, , n,
∑ a (5)
k=1 kj
where ∑k=1 akj is the sum of the criteria per column in the aggregate matrix, and aij p represents the preference value of the criterion in the aggregated comparison matrix.
Step 7. Compute the weights of the criteria by calculating the row averages from the normalized matrix obtained in the previous step.
Step 8. Consistency test of the pairwise comparison matrix.
Calculate the Consistency Index (CI) for each matrix; the CI can be computed based on Eq. (6). This step is crucial for assessing the consistency of the experts' evaluations during the pairwise comparisons.
λmax−n
= . (6)
Step 9. Determine the Consistency Ratio (CR) for the matrices by dividing the Consistency Index (CI) by the Random Index (RI), as outlined in Eq. (7).
CI
CR = . (7)
RI
In Eq. (8), λmax is the principal eigenvalue of the pairwise comparison matrix, and the following can be calculated by the following formula:
∑j=1BijWj
λmax = . (8)
Wi
The matrices are deemed consistent if the values of CR are less than 0.1 [86]; otherwise, decision-makers must reassess their evaluations because inconsistencies would violate the transitivity principle [87]. Table 6 presents the Random Index (RI) values corresponding to each matrix used in the Saaty method.
Table 6. Random Index (RI).
This table is shown in the PDF version of the article.
4. Results
4.1 Results of Phase 1: DEA Method
The DEA Malmquist-OV model was applied to assess the performance changes of 35 countries from 2013 to 2019, evaluating and ranking DMUs through the Malmquist Productivity Index (MPI), CU, and FS values. Analysis of the CU index, as shown in Table 7, reveals that most countries maintained a stable value of 1 over multiple years, indicating consistent relative efficiency without significant changes. The 2015-2016 period showed the most notable improvement with an average of 1.00779, reflecting DMUs catching up and improving efficiency compared to advanced units. However, the 2018-2019 period had the lowest average of 0.999584, suggesting some units failed to maintain efficiency and showed signs of decline. The overall average of 1.002692 indicates that DMUs generally maintained or improved efficiency during this period.
DMU5 stood out with the highest average index (1.047656), particularly in 2015-2016 with an index of 1.248364, demonstrating superior performance improvement. The highest average index could be attributed to the adoption of new technologies or management improvements, rapidly enhancing DMU5's competitiveness. Similarly, DMU19 showed notable improvements in certain years, with a peak index of 1.142135 in 2017-2018, while DMU8 had a significant improvement of 1.167513 in 2018-2019, indicating successful efforts to catch up with leading units.
Conversely, some DMUs showed signs of decline in efficiency catch-up ability. DMU6 had the lowest average index among DMUs at 0.98017, with significant drops to 0.920616 and 0.908923 in 2017-2018 and 2018- 2019, respectively. The lowest average index of DMUs indicates that this unit struggled to maintain operational efficiency, possibly due to factors such as a lack of investment or ineffective management. DMU35 and DMU19 also experienced declines, with indices dropping to 0.939773 and 0.910115 in 2017- 2018 and 2018-2019, respectively.
The maximum and minimum values of the CU index over the years show significant fluctuations in the ability to catch up with efficiency among DMUs. DMU5 had the highest index of 1.248364 in 2015-2016, reflecting outstanding improvement, while DMU6 had the lowest index of 0.908923 in 2018-2019, indicating a considerable decline. The highest Standard Deviation (SD) of 0.043481 in 2015-2016 indicates clear differences between DMUs in their ability to improve performance, while other years had lower SDs, showing more uniformity in catch-up ability. Overall, 28 out of 35 countries had a stable average CU efficiency of 1. The highest average CU efficiency was observed in DMU5, DMU8, DMU19, DMU32, and DMU35, indicating that the outputs of these countries improved due to enhanced technical efficiency rather than FS. Conversely, DMU6 and DMU25 did not achieve CU efficiency with average values below 1.
Table 7. CU Index.
This table is shown in the PDF version of the article.
The FS, as presented in Table 8, reflects changes in frontier efficiency over time and remained relatively stable for many countries with FS=1. The stability of FS suggests these DMUs maintained stability in production operations and technology. While not showing dramatic improvements, they also didn't experience efficiency declines. This group may represent units that have reached a certain level of efficiency and did not experience breakthroughs or declines during the analyzed period. The 2013-2015 period recorded slight improvements, with the highest average in 2014-2015 (1.002646), indicating progress in enhancing production efficiency and technology. However, from 2016 to 2017, there was a notable decline, with the average dropping to 0.975147, suggesting many DMUs couldn't maintain development momentum or faced technological challenges. Some DMUs, particularly DMU1, DMU2, and DMU33, showed marked improvements in frontier efficiency. DMU1 had the highest average index (1.019937) throughout the period, indicating continuous technological improvements and productivity enhancements. Specifically, in 2015-2016 and 2017-2018, DMU1's indices reached 1.03698 and 1.077355, respectively, showing significant advancements in production efficiency. DMU2 and DMU33 maintained stability at one and had periods with indices above 1, although their overall averages were 1.008759 and 1.004266, respectively, still reflecting efficiency improvements. These DMUs may be benefiting from policies investing in new technologies or improving operational processes, thereby maintaining competitive advantages and high efficiency.
Table 8. FS index.
This table is shown in the PDF version of the article.
In contrast to the DMUs that demonstrated improvement, several DMUs, most notably DMU25, exhibited a significant decline in frontier efficiency over multiple years. DMU25 recorded the lowest average index among all DMUs, achieving only 0.865306. Particularly alarming was the period from 2016 to 2017, during which DMU25 experienced a precipitous decline, with its index plummeting to an exceptionally low value of 0.202553. This dramatic deterioration suggests that this unit encountered severe issues related to production efficiency or management practices.
The underlying causes of this decline may be attributed to various external factors, including market volatility, financial crises, or inadequate investment in technology and human capital. A salient example of these external pressures can be observed in Turkey's experience during 2016. The nation faced 30 incidents of severe terrorist attacks perpetrated by the Kurdistan Workers' Party (PKK) and the self-proclaimed Islamic State (IS), resulting in substantial casualties among security forces and civilians. These acts of terrorism, coupled with political instability and armed conflicts, precipitated a surge in Turkey's inflation rate and a 15% devaluation of the Turkish Lira against the US Dollar. Consequently, investor confidence was significantly eroded, contributing to Turkey's remarkably low FS score.
DMU13 encountered similar challenges, registering an average index of 0.961769, with a particularly sharp decline to 0.805335 in 2017-2018. These DMUs may need to critically reassess their development strategies and implement structural reforms to facilitate recovery and enhance efficiency in subsequent years. Such measures could include diversifying economic activities, strengthening institutional frameworks, and increasing investments in research and development to bolster resilience against external shocks and improve long-term productivity.
An analysis of the maximum and minimum values of the indices across the years reveals significant fluctuations in frontier efficiency among the DMUs. DMU18 exhibited the highest index, peaking at 1.224292 in 2013-2014, which reflects a superior technological improvement. This substantial enhancement may be attributed to the implementation of novel technologies or significant management initiatives. Conversely, DMU25 recorded the lowest index of 0.202553 in 2016-2017, indicating a severe decline that could be ascribed to external factors or internal issues. The highest Standard Deviation (SD) was observed in 2016- 2017 (0.135828), highlighting substantial efficiency disparities among DMUs during this period, possibly due to market volatility. In contrast, other years demonstrated lower SDs, suggesting greater stability across DMUs. These variations in the FS also reflect the diverse economic, technological, and managerial contexts of each DMU, providing crucial information for long-term efficiency evaluations of individual units.
Examining the MPI presented in Table 9, we observe fluctuations in DMU productivity from 2013 to 2019, illustrating improvements or declines in operational efficiency. DMU18 emerged as the unit with the highest index throughout the period, achieving 1.224292 in 2014-2015. The highest index of DMU represents a significant advancement, demonstrating a notable improvement in productivity. The sharp increase in this index may be the result of implementing advanced technologies or robust management improvement measures, enabling DMU18 to achieve exceptional growth in production efficiency. In stark contrast, DMU25 exhibited a severe decline, recording the lowest index of 0.209484 in 2016-2017. This substantial decrease may stem from various adverse factors, including internal national challenges or external influences such as market volatility or unfavorable policy changes.
Table 9. MPI.
This table is shown in the PDF version of the article.
A noteworthy observation is the Standard Deviation (SD) across the years, particularly in 2016-2017, which reached its peak value (0.137128). The standard deviation across the years indicates a pronounced divergence among DMUs in terms of productivity changes, with some units demonstrating significant improvements while others experienced declines. This substantial variability may reflect influencing factors such as fluctuating market conditions, uneven adoption of new technologies, or disparities in managerial capabilities among DMUs. In contrast, other years exhibited lower standard deviations, for instance, 2013-2014 (0.015131) and 2015-2016 (0.013477), suggesting greater stability and less disparity in productivity among units during these periods.
The average index of DMUs across the years generally oscillated around 1, indicating overall stability in productivity across all units. However, a slight decrease in the average index for 2016-2017 (0.980408) could be interpreted as a challenging period for some DMUs, with productivity declining possibly due to more pronounced impacts from economic factors or external environmental pressures. Conversely, the highest index (1.107708) in 2016-2017 for DMU6 reflects that some units successfully navigated difficulties and even improved productivity.
In general, the MPI table provides a comprehensive view of efficiency levels and productivity changes among DMUs. Units such as DMU18 demonstrated robust improvements, while others like DMU25 faced significant challenges, reflecting the diversity in adaptability and improvement capabilities within a volatile, competitive environment. The substantial variations in indices also suggest that some DMUs successfully capitalized on opportunities and enhanced productivity, while others struggled to leverage these opportunities or encountered considerable obstacles.
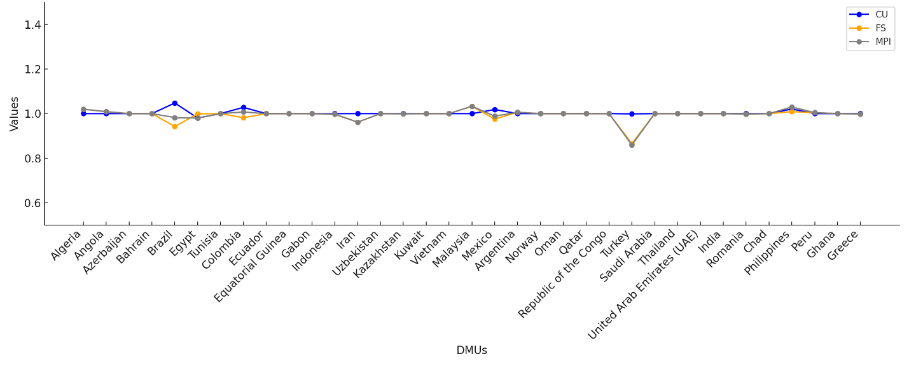
Fig. 3 illustrates the relationship between the average FS, CU, and MPI of the DMUs. Most countries exhibited stability in performance. Generally, the trend of MPI changes closely aligns with FS, indicating that the overall productivity improvement of DMUs primarily resulted from enhancements in innovation capabilities and optimization of production processes, rather than from catching up to standards. This insight enables managers and governments to assess that reform efforts and investments in technology are yielding positive outcomes, fostering a conducive environment for economic development.
4.2 Results of Phase 2: Clustering by K-Means and DBSCAN
Using DEA Malmquist analysis, we categorized 35 countries into distinct groups via K-means clustering. The ANOVA results in Table X reveal significant differences in MPI performance across clusters, with an F-value of 131.482 and a significance level (p < 0.001), confirming that at least one cluster has a significantly different mean MPI compared to others. The difference in MPI mean validates that the clustering captures meaningful performance variations among DMU groups.
Table 10. ANOVA.
This table is shown in the PDF version of the article.
Based on this analysis, countries were classified into three categories, as shown in Table 11. The high-performance market group includes 30 countries, such as Azerbaijan, Bahrain, Tunisia, and Ecuador, characterized by economies heavily reliant on petroleum exports. These nations exhibit strong demand for extraction equipment and advanced technologies, supported by robust energy infrastructure and investment-friendly government policies. For example, Azerbaijan’s oil sector contributes 42% to its GDP, driven by projects like the Baku-Tbilisi-Ceyhan pipeline. Bahrain leverages its long-established infrastructure and recent discoveries, despite producing 50,000 barrels per day and sharing 150,000 barrels daily from the Abu Safa field with Saudi Arabia, being the smallest GCC producer. Vietnam, another notable example, holds significant potential with estimated reserves of 600-700 million m³ of oil and 800 billion m³ of gas [88]. Turkey represents a unique case as the sole member of the volatile market category. Its strategic position between Europe and Asia is counterbalanced by frequent political and economic fluctuations that create market instability [89]. Despite challenges, Turkey shows significant potential, exemplified by the Sakarya field with its 710 billion m³ reserves. The country has also demonstrated a commitment to energy sector development through initiatives like the $1 billion World Bank renewable energy program, though market uncertainties persist [90].
The moderate-performance market group includes Brazil, Egypt, Mexico, and Iran. These nations possess substantial resource potential but face significant challenges. Brazil, while a leading South American producer with notable offshore fields like Lula and Buzios, continues to navigate political and economic instability. Egypt shows promise, particularly with the Zohr gas field's $6-10 billion investment plan, but requires substantial infrastructure development. Iran and Mexico face additional complications from regulatory restrictions and international sanctions that affect market access [91], [92].
Table 11. Classification of markets.
This table is shown in the PDF version of the article.
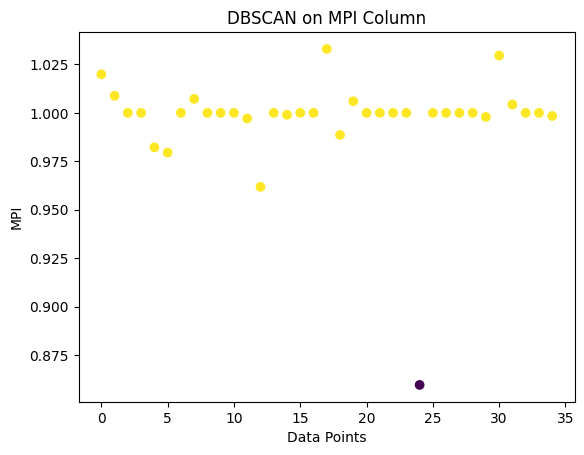
To complement K-means clustering, we applied the DBSCAN algorithm. DBSCAN identifies clusters based on data point density, marking low-density points as outliers without requiring a pre-specified number of clusters. While K-means produced three distinct groups, DBSCAN classified Turkey as an outlier (-1) and grouped the remaining 34 countries into a single cluster (0). Classifying Turkey as an outlier reinforces Turkey’s unique market position and the need for tailored strategies. K-means, however, offers a more actionable framework for petroleum equipment exporters by providing precise market categorizations for targeted entry strategies, risk assessment, and investment planning.
This classification system enables petroleum equipment exporters to tailor market entry strategies to each country group’s unique characteristics. The high-performance markets offer opportunities for technology-driven investments, volatile markets like Turkey require cautious, adaptable approaches, and moderate-performance markets demand strategies that address regulatory and infrastructural challenges. By leveraging these insights, companies can optimize resource allocation and enhance international expansion efforts in the complex global petroleum market.
4.3 Results of NZN-AHP
4.3.1 Expert panel
In terms of expert panel size, this selection is crucial to ensure reliable and valid outcomes. The choice to use 16 experts for the NZN-AHP method aligns with standard practices and guidelines in MCDM research. Typically, MCDM studies involve expert panels ranging from 10 to 30 members, depending on the study's complexity and scope. The use of 16 experts falls within this range and provides a balanced approach to capturing diverse insights while maintaining manageable data collection and analysis [73]. This size ensures the inclusion of varied perspectives without introducing excessive complexity or inconsistency, which can occur with larger panels.
Furthermore, selecting 16 experts allows for high-quality inputs, focusing on the expertise and relevance of the participants, which is critical in achieving reliable and meaningful results [20]. This approach aligns with findings from other studies that have successfully employed similar panel sizes in MCDM applications, such as those in supplier selection and risk assessments [70], [74]. Therefore, the panel size of 16 experts is both justified and effective for the study's objectives, ensuring comprehensive and robust decision-making while remaining practical and focused. The summary of respondents’ demographic information is shown in Fig. 3. Table 12 presents the results of the weight analysis from the experts participating in the study, illustrating the distribution of knowledge and the positions of each expert in the evaluation framework. This information not only provides insight into the experts but also reflects the quality and reliability of the collected data. By understanding the experience and educational background of each expert, the validity of the analytical results in the study is reinforced. Below is a summary of the experts' information, including their educational levels, job positions, and the weights calculated from their assessments.
Table 12. Distribution of expert weights and demographic information.
This table is shown in the PDF version of the article.
4.3.2 Results of the NZN-AHP method
In this section, we present the results of the NZN-AHP applied to the adaptation strategies for the petroleum equipment market entry in emerging economies. A total of 16 experts evaluated the proposed strategies within the inefficient markets group through pairwise comparisons, assessing the relative importance of each strategy in relation to the others.
In the context of adapting to inefficient markets, several strategies have been identified as crucial for success. Regulatory Compliance Customization (S11) emerges as the most critical strategy, holding a weight of 21.50%. The Regulatory Compliance Customization underscores the necessity of customizing equipment to meet local regulatory standards and environmental conditions, while leveraging relationships with government bodies for compliance, as highlighted by Wireman [31]. Following closely, Regional-Specific Product Modification (S15) ranks second with a weight of 20.56%, emphasizing the importance of adapting product features to suit regional operational practices and customizing products and services to meet specific market demands, as noted by Porter [34]. Flexible Financing Schemes (S12), ranked third at 19.48%, focuses on offering financing options tailored to local economic conditions, including developing leasing or installment payment programs for emerging markets, according to Pinto and Coutinho [32]. Fourth is Localized Service Networks (S13) with a weight of 19.34%, highlighting the need for the development of market-specific service and support networks through partnerships with local petroleum service companies, as stated by Paul [93]. Finally, Cultural Marketing Alignment (S14) ranks fifth with a weight of 19.12%, emphasizing the importance of localizing marketing and sales approaches to align with cultural norms and building a digital marketing strategy focused on specialized content, supported by Chaffey et al. [33]. This analysis reveals that regulatory compliance and product modification are paramount for companies seeking to succeed in emerging markets. By concentrating on these strategies, businesses can effectively navigate the complexities of local regulations and market demands, ensuring their offerings are both relevant and compliant.
Table 13. Crisp weight aggregated matrix of inefficient markets group.
This table is shown in the PDF version of the article.
Table 14. Weights and ranking results of NZN-AHP in inefficient markets group.
This table is shown in the PDF version of the article.
In stable markets, several strategies have emerged as essential for companies aiming to achieve success. Regional Manufacturing Consolidation (S21) stands out as the most crucial strategy, with a weight of 21.74%. The Regional Manufacturing Consolidation strategy emphasizes the necessity for companies to establish regional manufacturing hubs that can efficiently serve multiple emerging markets, enhancing operational efficiency and responsiveness. Following closely, Standardized Operational Training (S24) ranks second with a weight of 19.90%, highlighting the significance of creating standardized training programs for equipment operation and maintenance, which can help ensure consistency and quality across different regions. Core Component Standardization (S22) ranks third at 19.64%, pointing to the importance of standardizing core product components across markets to achieve economies of scale, thus reducing costs and increasing competitiveness. Global Brand Unification (S23) follows in fourth place with a weight of 19.40%, underscoring the need to develop a cohesive global brand identity that can effectively compete with international brands by creating premium product lines. Lastly, Centralized R&D Optimization (S25) ranks fifth with a weight of 19.32%, emphasizing the importance of centralizing research and development efforts to leverage innovations across various markets.
Table 15. Weights and ranking results of NZN-AHP in stable markets group.
This table is shown in the PDF version of the article.
In the context of arbitrage strategies, the analysis reveals key approaches for companies aiming to leverage their competitive advantages in emerging markets. Technological Capability Leverage (S31) ranks as the most critical strategy, with a weight of 21.44%. The Technological Capability Leverage strategy highlights the importance of utilizing advanced technological capabilities to enhance product quality and innovation, which can provide a significant edge in the competitive landscape. Strategic Global Sourcing (S32) follows closely in second place with a weight of 20.07%. This strategy emphasizes the need for companies to strategically source raw materials and components from low-cost regions, thereby optimizing costs and improving delivery times, which is crucial for maintaining competitive pricing. In third place is Diplomatic Advantage Utilization (S35), with a weight of 19.73%, underscoring the value of capitalizing on China's diplomatic ties for preferential access to markets, particularly through initiatives like the Belt and Road Initiative. Cost-Based Competitive Pricing (S33) ranks fourth with a weight of 19.55%, indicating the importance of leveraging lower manufacturing costs to offer competitive pricing and cost-efficient solutions tailored for state-owned oil companies. Lastly, Knowledge Transfer Exploitation (S34) occupies the fifth position with a weight of 19.22%, signifying the potential benefits of offering technology transfer as part of business deals to exploit knowledge differentials.
Table 16. Weights and ranking results of NZN-AHP in high efficiency markets group.
This table is shown in the PDF version of the article.
4.3.3 Discussion
After an intensive review of a vast number of previous research, the knowledge revealed that there have been numerous studies digging into the issue in various fields of the social economy, applying different methods from quantitative to qualitative. However, in most cases, previous studies either focus on customer behavior or take a broad view of the supply chain from pre-harvest to post-harvest steps [94], [95]. This study proposed to focus on the production line of food service operations, from receiving ingredients to serving finished food to customers, which are the main points causing food waste in a business. The research distinguishes from other studies by integrating grey theory with the Delphi technique and the DEMATEL method. These methods consider the strategic view from the managers and find the interdependence among the key drivers, helping to reveal the root causes and propose effective controlling strategies to tackle the issue. By integrating grey theory, the study allows for taking into account the circumstances of [96] agueness. The application of the grey Delphi-DEMATEL method will assist the food service managers in identifying priorities in decision making when faced with the food waste problem. It also contributes to the scholarly knowledge in Vietnam about controlling food waste.
The results of data analysis confirmed the significance of six dimensions: Purchasing, Receiving, Inventory controlling, Preparing, Selling, and General Drivers for food service businesses to take forward the food waste issue. This finding supports previous leading studies: Luo et al. [95] prioritized the role of production, post-harvest handling and storage, processing, distribution, and retail. Or Filimonau et al. [97] expressed the causes and solutions in three steps: pre-kitchen, kitchen, and post-kitchen. Wu et al. [98] mainly focused on the production steps that happened within the service provider team by expressing the importance of procurement, warehousing, and production. Having similar findings with this research but more on the side of consumers, Wu et al. [98] confirmed the priority of customers’ role in reducing food waste.
The findings of the Delphi technique showed that IC8 (Store location), IC9 (Strict regulation on food hygiene and safety), SE6 (Random customer purchase), and PU8 (Ingredients forecast fail) were not significant and were eliminated from the key drivers list. This conclusion of the panel list was in a different direction from the previous study. Ribeiro et al. [99] emphasized that the store location (IC8) might influence the amount of food waste, especially when it concerns the size of the store. The researcher believed that it has a significant relation with the forecast and predicting the demand. In fact, the relation between store location and the amount of food waste was found to differ in various studies. The result depends on the characteristics of the market and the business area [100]. Moreover, most of the previous studies looked into the retail market in general, while the number of studies that mentioned store location for food service businesses is quite limited. In this research, we confirmed that store location (IC8) has no significant relation with the amount of food waste in the Vietnamese food service industry. The strict regulation on food hygiene (IC9) and safety has a relationship with the amount of food waste due to the requirement of either the government or the F&B businesses [98]. The food safety regulation may lead to the ingredient disposal, even if it might still be edible. Also mentioned but not considered significant, Moraes et al. [101] indicated that this factor was not a vital matter with the Brazilian market, as they might not be aware of it. The Vietnamese government has launched the Food Safety Law a long time ago, but it is still generous, which may explain the different findings from the previous studies.
The difference in decision about Random customer purchase (SE6) may be because of the different characteristics in the operation manner and customer habits of the Vietnamese market. Restaurants in Vietnam often please customers’ preferences by accepting any changes to their original dishes or even making a dish not on their published menu. Thus, pleasing customers’ preferences could be the reason that random customer purchase was not a significant driver of food service operators in Vietnam. Ingredients forecast fail (PU8) was mentioned often in previous studies as a main cause of food waste for all kinds of food & beverage enterprises. It could happen because of failure or inaccuracy in forecasting the market demand, or inevitable [102]. Previous western researchers also indicated that errors in forecasting demand are a significant reason leading to food waste [103–105]. The Vietnamese food service business is distinguished by the street food restaurants and merchants who do both wholesale and retail. This study focuses on the broad view of food service operations, which includes all types of service from fine-dining to local street vendors. Buying ingredients based on forecasting demand may fit with the big standardized operation, but family or street food businesses may work differently. After eliminating four factors: Store location, Strict regulation on food hygiene and safety, Random customer purchase, and Ingredients forecast fail, a comprehensive analysis of the other 34 key drivers revealed the interrelation among them, as well as finding the root cause of the food waste issue by the grey DEMATEL method.
The subgroup analysis showed that in the Purchase process, Communication failure with the supplier and bankruptcy of the supplier (PU2), Poor relationship with suppliers (PU5), Lack of reliable suppliers (PU6), and Supply chain inefficiencies (PU7) were the main reasons causing food waste in this step. This finding supported the previous studies about the significance of the factors; however, there were slight differences in terms of the cause-and-effect relationship. Mithun Ali et al. [106] mentioned that communication failure with the supplier and their bankruptcy were the effect factors, while it is the root cause factor in this research. Similarly, Lack of reliable suppliers (PU6) and Supply chain inefficiencies (PU7) were proved to be effective factors in the study of Magalhães et al. [107]. The reason could be that in the previous research, authors looked into the relationship among the factors from a broad view as a whole, while this research put them into subgroups as a subsystem.
The analysis of the receiving process pointed out that Poor quality and defective products (RE1) and Products with very short expiry dates/shelf life (RE4) were the main reasons for food waste in food service operations. This finding contributed to the studies of Moraes et al. [108] and Magalhães et al. [107] by indicating that these two factors were the root cause of the issue. In the Inventory control group, it was noted that Physical inventory error (IC3), Blackout (IC5), Poor inventory management (IC6), and Large menu (IC7) were the significant factors leading to wasting food. This result was in line with the indication in the literature review section. In the Preparing and Selling steps, the analysis showed that Lack of capacity (PP1), Unskilled staff (PP4), Employees training (PP6), Staff serving mistake (SE1), Apprehension of customer bad feedback (SE2), and Inappropriate portion size (SE5) were the most important factors causing food waste in the operation. With the General drivers, Poor leadership in following the standard and procedures (GE2), and Poor waste management (GE5) were vital because they are the root cause of the food waste issue. Findings of key drivers in the Preparing and selling process, as well as general drivers, supported the results of previous studies. Mithun Ali et al. [106] said that the lack of capacity, capacity inflexibility or underutilization, inability to produce high-quality products or fulfill customers’ demand, cause inefficiency in the production line, with consequent food waste and loss for the businesses. International studies have expressed the gravity of unskilled staff and employees' training toward solving the food loss issue, which was concluded as unqualified staff, [98], [103], [109]. The result of the cause-and-effect factors was slightly different from the literature review, which can be explained by the distinction between the market and the running operation manner.
4.4 Discussion
4.4.1 Discussions of DEA malmquist’s results
Countries in the highly efficient market group, such as Malaysia, have demonstrated significant improvements in productivity and technological efficiency. As a petroleum exporting nation, Malaysia has benefited from rising global energy prices. The country's supportive policies, including the Bumiputra Economic Empowerment Program launched in 2013, have helped Malaysia achieve $38.52 billion in exports of fuels, oils, gas, and distillation products in 2018 [110]. Despite varying levels of GDP and FDI as reported by The GlobalEconomy.com, countries in this group recognize the importance of these indicators in driving economic growth and job creation, with a particular focus on the petroleum industry. These markets are characterized by rapid adoption of technological and managerial advancements, maintaining and enhancing production efficiency. They are considered ideal destinations for high-tech products due to their infrastructure readiness and commitment to technological innovation, creating a highly competitive environment and a primary target for petroleum equipment exporters, especially those from China.
For these highly efficient markets, Chinese companies need to emphasize providing high-quality products at competitive prices compared to Western or Japanese competitors. China's advantage of large-scale production allows for cost reduction and provision of reasonably priced petroleum equipment while meeting technical standards [3], [40]. An effective strategy is to focus on equipment capable of optimizing production processes, reducing emissions, or enhancing automation in operations. Additionally, companies should prioritize building strategic partnerships with local firms and participating in joint Research and Development (R&D) projects. Providing in-depth technical support services, including regular maintenance and equipment updates, is also crucial in maintaining long-term customer relationships and building trust in these competitive markets.
Countries like Bahrain, Oman, and Kazakhstan represent stable markets within the OPEC+ group, maintaining consistent productivity and efficiency over the years. These countries show clear differentiation in terms of economic development, particularly in their dependence on petroleum [111]. Some, like Saudi Arabia, the UAE, and Norway, have been investing heavily in advanced petroleum extraction technologies and diversifying their industries. For instance, Saudi Arabia announced plans to build the $500 billion NEOM mega-city project in the northern Red Sea. The petroleum industry contributes significantly to GDP, national budget revenues, and exports in these countries. However, some, like India and Thailand, depend on oil imports to meet domestic consumption needs. There's also a trend towards energy transition, with countries like Norway, UAE, and Vietnam seeking to reduce dependence on oil by developing renewable energy and investing in clean energy sectors. In Vietnam, for example, domestic oil production has continuously declined from 16.9 million tons in 2015 to 9.7 million tons in 2020 [112].
For these stable markets, Chinese companies should focus on providing equipment at affordable prices while emphasizing durability and stability. Instead of directly competing on high technology with countries like Germany or the United States, companies can emphasize practicality and long-term efficiency. Positioning oneself as a reliable supplier with reasonable costs and quality after-sales service will be key. Chinese companies can also leverage their advantage in providing flexible financial solutions, such as long-term equipment leasing contracts or comprehensive service packages. In China, financial leasing sales account for 10% of total machinery and equipment sales, indicating a potential for such strategies in these markets [113]. Countries like Turkey, showing a decline in productivity and efficiency, belong to the group of inefficient markets. These countries may face economic, political, or management issues, making it difficult for them to keep up with more advanced nations. For example, Turkey has witnessed severe declines in specific periods due to political instability and a lack of investment in new technologies [3]. The petroleum industry plays a crucial role in the economies of countries like Iran, Kazakhstan, Brazil, and Mexico. Although some countries like Turkey and Egypt are not major oil producers, they play a strategic role in energy transportation. According to Statista, about 40,000 ships annually pass through the Bosporus Strait each year (35,146 ships in 2022 and 39,000 in 2023), and 24,820 ships passed through the Suez Canal in 2022.
Penetrating these inefficient markets requires a flexible and cautious strategy. Chinese companies can exploit advantages in competitive pricing and supply flexibility. Low-cost, durable, and easy-to-maintain products will suit the needs of these countries, where budgets for petroleum projects are often limited. China can also leverage diplomatic policies and initiatives such as BRI to support these less developed countries through preferential loans and investments in petroleum infrastructure [114]. Companies can develop flexible financial support options, consider joint ventures or cooperation with local governments, and focus on providing comprehensive solutions from equipment supply to technical support and personnel training.
4.4.2 Discussions of clustering by K-Means and DBSCAN results
The application of K-means and DBSCAN clustering methods in this study provides a robust framework for segmenting 35 emerging economies based on their Malmquist Productivity Index (MPI) scores, offering valuable insights into market prioritization for Chinese oil and gas equipment manufacturers. K-means, a centroid-based algorithm, effectively partitioned the economies into three distinct clusters—high, stable, and low efficiency—based on their productivity performance. This structured segmentation aligns with the algorithm’s strength in producing interpretable, scalable groupings for large datasets [53], [54]. The high-efficiency cluster likely includes economies with substantial infrastructure investment and favorable economic indicators, such as Saudi Arabia or the UAE, which are prime targets for market entry due to their robust oil and gas sectors. The stable cluster may represent economies with consistent but moderate growth, while the low-efficiency cluster could include markets with higher risks or underdeveloped infrastructure. However, K-means’ reliance on predefined cluster numbers (k=3) and sensitivity to outliers may limit its ability to capture nuanced market dynamics, particularly in heterogeneous datasets where economies exhibit unique trajectories [60].
DBSCAN, employed as a complementary density-based clustering method, addressed these limitations by validating K-means results and identifying outliers without requiring a predefined number of clusters [61]. By grouping economies based on density and proximity, DBSCAN detected clusters of arbitrary shapes and isolated outliers like Turkey, which may exhibit distinct productivity patterns due to its geopolitical positioning or economic volatility [61]. These outliers are strategically significant, as they may represent untapped “blue ocean” opportunities with less competition from Western incumbents [9]. DBSCAN’s ability to handle noise points ensured that atypical economies were not forced into ill-fitting clusters, enhancing the robustness of the market segmentation. However, its performance depends on the calibration of parameters (ε and minPts), and suboptimal settings could overlook smaller clusters or misclassify noise points [66]. The dual-clustering approach mitigated these challenges by combining K-means’ structured segmentation with DBSCAN’s sensitivity to anomalies, providing a comprehensive view of market opportunities. This integrated methodology supports Chinese manufacturers like Hoffman in prioritizing high-potential markets and tailoring entry strategies, aligning with the study’s objective to navigate the TUNA global environment.
4.4.3 Discussions of NZN-AHP method’s results
NZN-AHP results provide valuable insights into the prioritization of market entry strategies for Chinese petroleum equipment manufacturers in different market categories. These findings offer a nuanced understanding of how companies should tailor their approaches based on market efficiency levels.
In inefficient markets, the emphasis on Regulatory Compliance Customization (S11) as the top strategy, with a weight of 21.50%, underscores the critical importance of navigating complex and often challenging regulatory environments. The Regulatory Compliance Customization strategy aligns with Wireman’s assertion that compliance is fundamental in these markets, where regulatory frameworks may be less developed or more volatile [34]. The high ranking of this strategy suggests that companies must prioritize understanding and adapting to local regulations to establish a foothold in these markets. The second-ranked strategy, Regional-Specific Product Modification (S15), with a weight of 20.56%, highlights the need for product adaptability in inefficient markets. This finding supports Porter's emphasis on tailoring offerings to meet specific market demands [34]. In the context of petroleum equipment, this could involve modifying products to suit local geological conditions, operational practices, or resource types, thereby enhancing their appeal and functionality in these challenging markets.
For stable markets, the prominence of Regional Manufacturing Consolidation (S21) as the top strategy (21.74% weight) indicates a shift towards operational efficiency and scale. This approach aligns with Rugman and Verbeke's concept of regional strategies in international business [35]. By establishing regional manufacturing hubs, companies can optimize their production processes while maintaining proximity to multiple markets, potentially reducing costs and improving responsiveness to local demands. The high ranking of Standardized Operational Training (S24) in stable markets, with a 19.90% weight, reflects the importance of consistency and quality in operations. This strategy, as supported by S. Becker's human capital theory, suggests that investing in standardized training programs can enhance operational efficiency and product quality across different markets, contributing to a company's competitive advantage [38].
In highly efficient markets, the primacy of Technological Capability Leverage (S31), weighted at 21.44%, underscores the critical role of advanced technology in gaining a competitive edge [34]. This finding aligns with Porter's view on technological leadership as a source of competitive advantage. For Chinese manufacturers, this implies a need to focus on innovation and high-tech solutions to compete effectively in these sophisticated markets. The strong showing of Strategic Global Sourcing (S32) as the second-ranked strategy in efficient markets, with a 20.07% weight, highlights the importance of optimizing the global value chain. This strategy, consistent with Christopher et al.'s work on supply chain management, suggests that companies should leverage international sourcing networks to enhance cost-efficiency and quality, crucial factors in highly competitive markets [115].
Across all market types, the relatively balanced weights of the top strategies (ranging from approximately 19% to 22%) indicate that a holistic approach is necessary for successful market entry. This balance suggests that while a specific strategy may be prioritized, neglecting others could lead to suboptimal outcomes. Companies should, therefore, consider implementing a comprehensive plan.
The integration of DEA Malmquist and NZN-AHP in this study has created a comprehensive and robust analytical framework for assessing market efficiency and developing market entry strategies for Chinese petroleum equipment manufacturers. This combination leverages the strengths of both methods, creating a multidimensional approach to address the complex issue of selecting and prioritizing international market entry strategies. The DEA Malmquist method was used to evaluate the efficiency and productivity of 35 countries from 2013 to 2019, allowing for the classification of markets into three groups: highly efficient, stable, and inefficient markets [116]. This approach provides an overall picture of the country's performance based on multiple input and output indicators, reflecting economic, political, and technological factors affecting the petroleum industry. The DEA Malmquist results revealed significant differences in efficiency and productivity among market groups, providing an essential basis for developing appropriate market entry strategies.
Meanwhile, the NZN-AHP method was applied to prioritize market entry strategies for each market group identified by the DEA Malmquist. This method leverages the ability to handle uncertain and ambiguous information of neutrosophic theory, combined with the ability to assess the reliability of information through Z-numbers [28], [29],[117] Handling uncertain and ambiguous information of neutrosophic theory is particularly suitable in the context of evaluating international business strategies, where there are many uncertain and complex factors.
The combination of these two methods creates an effective two-step analysis process: The first step uses DEA Malmquist to evaluate and classify markets based on efficiency and productivity, providing an objective basis for grouping markets with similar characteristics. The second step applies NZN-AHP to identify and prioritize the most appropriate market entry strategies for each identified market group. This approach allows Chinese petroleum equipment manufacturers not only to identify potential markets based on efficiency but also to customize their strategies to suit the specific characteristics of each market group. The results of combining these two methods have brought valuable insights: For highly efficient markets such as Malaysia, Algeria, and Colombia, DEA Malmquist showed significant improvements in productivity and technological efficiency. NZN-AHP suggested prioritizing Technological Capability Leverage (S31) and Strategic Global Sourcing (S32) strategies, reflecting the need for high-tech solutions and efficient supply chains in these competitive markets [34], [115]. For stable markets like Bahrain, Oman, and Kazakhstan, DEA Malmquist indicated stability in productivity and efficiency. NZN-AHP proposed prioritizing Regional Manufacturing Consolidation (S21) and Standardized Operational Training (S24) strategies, reflecting the need to balance operational efficiency with adaptation to regional diversity [35], [38], for inefficient markets such as Turkey, Brazil, and Iran, DEA Malmquist pointed to declines in productivity and efficiency. NZN-AHP suggested prioritizing Regulatory Compliance Customization (S11) and Regional-Specific Product Modification (S15) strategies, reflecting the need for a cautious and flexible approach in these volatile markets [31].
This combination not only provides a comprehensive approach to evaluating and prioritizing market entry strategies but also enhances the reliability of results through the use of both quantitative data (in DEA) and expert assessment (in NZN-AHP). This combined method can be considered an essential methodological contribution in the field of international business strategy research, especially in the context of the global petroleum industry. However, it should be noted that this combined approach also has some limitations. For example, DEA Malmquist depends on the quality and availability of input data, while NZN-AHP relies on subjective expert assessments. Additionally, this model assumes that the proposed strategies will be suitable for all countries within the same market group, which may not always be true due to cultural and economic diversity among countries. Nevertheless, the combination of DEA Malmquist and NZN-AHP in this study has provided a robust and comprehensive analytical framework for assessing market efficiency and developing market entry strategies. This approach is not only valuable for Chinese petroleum equipment manufacturers but can also be widely applied in other industries and international business contexts.
5. Conclusion
This study introduces an integrated framework combining DEA Malmquist, K-means, DBSCAN, and Neutrosophic Z-Number Analytic Hierarchy Process (NZN-AHP) to assess market efficiency and prioritize entry strategies for Chinese oil and gas equipment manufacturers in emerging markets. Key contributions include the effective classification of 35 emerging economies into three performance-based clusters (high, stable, low efficiency) using DEA Malmquist and clustering methods, and the prioritization of tailored entry strategies for each cluster via NZN-AHP. This approach innovatively blends quantitative efficiency analysis with qualitative decision-making under uncertainty, offering practical guidance for firms like Hoffman to navigate the TUNA global environment. The methodology advances international business strategy literature by providing a robust, data-driven tool for market selection and strategic planning, supporting China’s “Going Global” ambitions in high-end manufacturing.
Despite its contributions, the study has limitations. First, the DEA Malmquist analysis relies on data from 2013–2019, which may not capture recent economic shifts or geopolitical changes, such as U.S.-China trade tensions in 2025. Second, the NZN-AHP method may be subject to expert bias, potentially affecting strategy prioritization. Third, the findings are primarily tailored to the oil and gas equipment sector and Chinese manufacturers, limiting generalizability to other industries or regions. Fourth, the static nature of the recommendations may not account for dynamic market changes. Finally, the assumption of homogeneity within clusters may oversimplify market-specific nuances.
These limitations suggest avenues for future research. Longitudinal studies could track market efficiency and strategy performance over time to enhance adaptability. Applying the framework to other industries, such as renewable energy, could broaden its relevance. Incorporating country-specific factors, like regulatory frameworks or cultural differences, would refine market segmentation. Engaging diverse stakeholders, such as local partners or regulators, could mitigate bias in NZN-AHP. Validating the framework’s outcomes through case studies of implemented strategies would strengthen its practical utility. Additionally, integrating sustainability considerations, such as green energy transitions, could align the framework with global trends. In conclusion, this study provides a comprehensive, data-driven approach for Chinese oil and gas equipment manufacturers to prioritize and strategize market entry in emerging economies. By addressing efficiency, segmentation, and uncertainty, it equips firms to optimize resource allocation and tailor strategies to diverse markets. While limitations exist, the framework’s flexibility and robustness offer significant potential for refinement and broader application, paving the way for future research to enhance global market expansion strategies in the evolving energy sector.
Acknowledgments
The authors would like to express their heartfelt appreciation and gratitude to Vietnamese experts and policymakers for their contributions to this study.
Conflicts of Interest
The authors declare no conflict of interest.
References
- [1] Bahadori, A. (2016). Essentials of oil and gas utilities: process design, equipment, and operations. Gulf Professional Publishing. https://books.google.com/books.
- [2] Grand View Research. (2022). Share & trends analysis report by product (dietary supplements, functional food, functional beverages), by region (north america, europe, apac, csa, mea), and segment forecasts, 2021-2030. Grand view research available from. https://www.grandviewresearch.com/industry-analysis/global-oil-gas-separation-equipment-market
- [3] Ministry of Industry and Trade of the Socialist Republic of VietnamMinistry of Industry and Trade of the Socialist Republic of Vietnam. (2024). Why will China still hold the position of “world factory”? https://moit.gov.vn/tin-tuc/phat-trien-cong-nghiep/vi-sao-vi-the-cong-xuong-the-gioi-van-se-do-trung-quoc-nam-giu-.html
- [4] KPMG China. (2024). White paper on chinese manufacturing enterprises going global. https://kpmg.com/cn/zh/home/insights/2024/04/chinese-manufacturing-enterprises-globalization-white-paper.html
- [5] TPPCKTE. (2024). Outline of the 14th Five-Year plan (2021-2025) for national economic and social development and vision 2035 of the people’s republic of China. https://www.fujian.gov.cn/english/news/202108/t20210809_5665713.htm
- [6] Mangelsdorf, A. (2011). The role of technical standards for trade between China and the European Union. Technology analysis & strategic management, 23(7), 725–743. http://dx.doi.org/10.1080/09537325.2011.592267
- [7] Liu, J., & Xie, J. (2020). Environmental regulation, technological innovation, and export competitiveness: An empirical study based on China’s manufacturing industry. International journal of environmental research and public health, 17(4), 1427. https://doi.org/10.3390/ijerph17041427
- [8] Briefing, C. (2024). Trump Raises Tariffs on China to 145% – Overview and Trade Implications. https://www.china-briefing.com/news/trump-raises-tariffs-on-china-to-145-overview-and-trade-implications/
- [9] Kim, W. C., & Mauborgne, R. A. (2014). Blue ocean strategy, expanded edition: How to create uncontested market space and make the competition irrelevant. Harvard business review Press. https://books.google.com/books
- [10] Khanna, T., & Palepu, K. G. (2010). Winning in emerging markets: A road map for strategy and execution. Harvard Business Press. https://books.google.com/books
- [11] Outlook, I. E. (2022). World energy outlook special report https://www. iea. org/reports/india-energy-outlook-2021. https://www.iea.org/reports/world-energy-outlook-2022
- [12] Wang, Z., & Sun, Z. (2021). From globalization to regionalization: The United States, China, and the post-Covid-19 world economic order. Journal of chinese political science, 26(1), 69–87. https://doi.org/10.1007/s11366-020-09706-3
- [13] Ghemawat, P. (2003). Semiglobalization and international business strategy. Journal of international business studies, 34(2), 138–152. https://doi.org/10.1057/palgrave.jibs.8400013
- [14] Frick, J., & Ali, M. M. (2014, September). The Importance of Emerging Markets for Petroleum Technology Companies in Norway: Management and Entry Operation Strategies. IFIP International Conference on Advances in Production Management Systems (pp. 481-488). Berlin, Heidelberg: Springer Berlin Heidelberg. https://doi.org/10.1007/978-3-662-44733-8_60
- [15] Feng, X. (2023). Internationalization Motives of Emerging Market Firms: A View from Chinese State-Owned Enterprises. Journal of advanced management science vol, 11(1). https://www.joams.com/2023/JOAMS-V11N1-11.pdf
- [16] Tachega, M. A., Yao, X., Liu, Y., Ahmed, D., Li, H., & Mintah, C. (2021). Energy efficiency evaluation of oil producing economies in Africa: DEA, malmquist and multiple regression approaches. Cleaner environmental systems, 2, 100025. https://doi.org/10.1016/j.cesys.2021.100025
- [17] Lai, H., O’Hara, S., & Wysoczanska, K. (2017). Rationale of internationalization of China’s national oil companies: seeking natural resources, strategic assets or sectoral specialization? In Managing china’s energy sector (pp. 87–105). Routledge. https://www.researchgate.net/
- [18] Ma, X., & Andrews-Speed, P. (2006). The overseas activities of China’s national oil companies: rationale and outlook. Minerals & energy-raw materials report, 21(1), 17–30. https://doi.org/10.1080/14041040500504343
- [19] Downs, E. S. (2010). Who’s afraid of China’s oil companies. Energy security, 74–78. https://www.brookings.edu/wp-content/uploads/2016/06/07_china_oil_downs.pdf
- [20] Chen, S. (2008). Motivations behind China’s Foreign oil quest: A perspective from the Chinese Government and the oil companies. Journal of chinese political science, 13(1), 79–
- [104] https://doi.org/10.1007/s11366-008-9017-7
- [21] Arenas, J. A. C., Campo, E. A., & Rojas, J. J. B. (2017). Application of DEA in international market selection for the export of goods. DYNA: revista de la facultad de minas. universidad nacional de colombia. Sede Medellín, 84(200), 376-382. https://dialnet.unirioja.es/servlet/articulo?codigo=5979883
- [22] Wang, C. N., Nguyen, P. H., Nguyen, T. L., Nguyen, T. G., Nguyen, D. T., Tran, T. H., … Phung, H. T. (2022). A two-stage DEA approach to measure operational efficiency in Vietnam’s port industry. Mathematics, 10(9), 1385. https://doi.org/10.3390/math10091385
- [23] Ketels, C. H. M., & Memedovic, O. (2008). From clusters to cluster-based economic development. International journal of technological learning, innovation and development, 1(3), 375–392. https://doi.org/10.1504/IJTLID.2008.019979
- [24] Karaca, Y., Cattani, C., Moonis, M., & Bayrak, Ş. (2018). Stroke Subtype Clustering by Multifractal Bayesian Denoising with Fuzzy C Means and K‐Means Algorithms. Complexity, 2018(1), 9034647. https://doi.org/10.1155/2018/9034647
- [25] Devadas, R. M., Hiremani, V., Bidwe, R. V., Gujjar, P., & CA, A. P. (2024, July). Hybrid clustering with quantum particle swarm optimization initialization for fuzzy C-Means and DBSCAN. In 2024 Second international conference on advances in information technology (ICAIT) (Vol. 1, pp. 1-4). IEEE. https://doi.org/10.1109/ICAIT61638.2024.10690825
- [26] Torra, V. (2010). Hesitant fuzzy sets. International journal of intelligent systems, 25(6), 529–539. https://doi.org/10.1002/int.20418
- [27] T., A. (1986). Intuitionistic fuzzy sets. Fuzzy sets and systems. https://doi.org/10.5555/1708507.1708520
- [28] Zadeh, L. A. (2011). A note on Z-numbers. Information sciences, 181(14), 2923–2932. https://doi.org/10.1016/j.ins.2011.02.022
- [29] Nguyen, P. H., Nguyen, L. A. T., Pham, H. A. T., Nguyen, T. H. T., Vu, T. G., & others. (2024). Assessing cybersecurity risks and prioritizing top strategies In Vietnam’s finance and banking system using strategic decision-making models-based neutrosophic sets and Z number. Heliyon, 10(19). https://www.cell.com/heliyon/fulltext/S2405-8440(24)13924-2
- [30] Ghemawat, P. (2007). Redefining global strategy: Crossing borders in a world where differences still matter. Harvard Business Press. https://books.google.com/books
- [31] Wireman, T. (2003). Maintenance management and regulatory compliance strategies. Industrial Press Inc. https://books.google.com/books
- [32] Pinto, J., & dos Santos, M. (2023). Asset-based structured finance of infrastructure projects. Forthcoming: research handbook on transport infrastructure projects. https://dx.doi.org/10.2139/ssrn.4571399
- [33] Chaffey, D., Ellis-Chadwick, F., & Mayer, R. (2009). Internet marketing: strategy, implementation and practice. Pearson education. https://books.google.com/books/about/Internet_Marketing.html?id=HcoRl2EZXiwC
- [34] Porter, M. E. (1985). Technology and competitive advantage. Journal of business strategy, 5(3), 60–78. https://doi.org/10.1108/eb039075
- [35] Rugman, A. M., & Verbeke, A. (2004). A perspective on regional and global strategies of multinational enterprises. Journal of international business studies, 35(1), 3–18. https://doi.org/10.1057/palgrave.jibs.8400073
- [36] Birkinshaw, J., Toulan, O., & Arnold, D. (2001). Global account management in multinational corporations: Theory and evidence. Journal of international business studies, 32(2), 231–248. https://doi.org/10.1057/palgrave.jibs.8490950
- [37] Steenkamp, J. B. E. M. (2020). Global brand building and management in the digital age. Journal of international marketing, 28(1), 13–27. https://doi.org/10.1177/1069031X19894946
- [38] Becker, G. S. (1975). Human capital: A theoretical and empirical analysis. National Bureau of Economic Research. http://www.nber.org/books/beck75-1
- [39] Murray, J. Y., Kotabe, M., & Westjohn, S. A. (2009). Global sourcing strategy and performance of knowledge-intensive business services: a two-stage strategic fit model. Journal of international marketing, 17(4), 90–105. https://doi.org/10.1509/jimk.17.4.90
- [40] Zeng, M., & Williamson, P. J. (2007). Dragons at your door: How Chinese cost innovation is disrupting global competition. Harvard Business School Press Boston, MA. https://www.researchgate.net
- [41] Kogut, B., & Zander, U. (1993). Knowledge of the firm and the evolutionary theory of the multinational corporation. Journal of international business studies, 24(4), 625–645. https://doi.org/10.1057/palgrave.jibs.8490248
- [42] Sági, J., & Engelberth, I. (2018). The belt and road initiative–a way forward to china's expansion. Contemporary chinese political economy and strategic relations, 4(1), 9-XI. https://rpb115.nsysu.edu.tw/var/file/131/1131/img/2374/CCPS4(1)-Sagi-Engelberth.pdf
- [43] Farrell, M. J. (1957). The measurement of productive efficiency. Journal of the royal statistical society series a: statistics in society, 120(3), 253–281. https://doi.org/10.2307/2343100
- [44] Färe, R., Grosskopf, S., Lindgren, B., & Roos, P. (1992). Productivity changes in Swedish pharamacies 1980--1989: A non-parametric Malmquist approach. Journal of productivity analysis, 3(1), 85–101. https://doi.org/10.1007/BF00158770
- [45] Malmquist, S. (1953). Index numbers and indifference surfaces. Trabajos de estadistica, 4(2), 209–242. https://doi.org/10.1007/BF03006863
- [46] Caves, D. W., Christensen, L. R., & Diewert, W. E. (1982). The economic theory of index numbers and the measurement of input, output, and productivity. Econometrica: journal of the econometric society, 1393–1414. https://doi.org/10.2307/1913388
- [47] Charnes, A., Cooper, W. W., & Rhodes, E. (1978). Measuring the efficiency of decision making units. European journal of operational research, 2(6), 429–444. https://www.sciencedirect.com/science/article/pii/0377221778901388
- [48] Fare, R., Grosskopf, S., & Lovell, C. A. K. (1994). Production frontiers. Cambridge university press. https://books.google.com/books
- [49] Zhu, J. (2009). Quantitative models for performance evaluation and benchmarking: data envelopment analysis with spreadsheets (Vol. 2). Springer. https://link.springer.com/book/10.1007/978-3-319-06647-9
- [50] Jain, A. K., & Dubes, R. C. (1988). Algorithms for clustering data. Prentice-Hall, Inc. https://dl.acm.org/doi/abs/10.5555/42779
- [51] Lee, J. S., Lee, H. T., & Cho, I.-S. (2022). Maritime traffic route detection framework based on statistical density analysis from AIS data using a clustering algorithm. Ieee access, 10, 23355–23366. https://ieeexplore.ieee.org/abstract/document/9721300
- [52] Li, M., Bi, X., Wang, L., & Han, X. (2021). A method of two-stage clustering learning based on improved DBSCAN and density peak algorithm. Computer communications, 167, 75–84. https://doi.org/10.1016/j.comcom.2020.12.019
- [53] Kanungo, T., Mount, D. M., Netanyahu, N. S., Piatko, C. D., Silverman, R., & Wu, A. Y. (2002). An efficient k-means clustering algorithm: Analysis and implementation. IEEE transactions on pattern analysis and machine intelligence, 24(7), 881–892. https://doi.org/10.1109/TPAMI.2002.1017616
- [54] Fernandez, P., Mourato, S., Moreira, M., & Pereira, L. (2016). A new approach for computing a flood vulnerability index using cluster analysis. Physics and chemistry of the earth, parts a/b/c, 94, 47–55. https://doi.org/10.1016/j.pce.2016.04.003
- [55] Li, H., Liu, J., Liu, R. W., Xiong, N., Wu, K., & Kim, T. (2017). A dimensionality reduction-based multi-step clustering method for robust vessel trajectory analysis. Sensors, 17(8), 1792. https://doi.org/10.3390/s17081792
- [56] Herman, E., Zsido, K. E., & Fenyves, V. (2022). Cluster analysis with k-mean versus k-medoid in financial performance evaluation. Applied sciences, 12(16), 7985. https://doi.org/10.3390/app12167985
- [57] Sitorus, Z., Iqbal, M., Siahaan, A. P. U., Wahyuni, S., & others. (2025). Analysis of the sales potential of BUMDES products using the k-means clustering algorithm. International journal of computer sciences and mathematics engineering, 4(1), 19–27. https://ijecom.org/index.php/IJECOM/article/view/100
- [58] Wang, D. (2025). Application of improved binary K-means algorithm in time and cost optimization for regional logistics Distribution Center Location. Informatica, 49(6). https://doi.org/10.31449/inf.v49i6.7215
- [59] Shang, R., Ara, B., Zada, I., Nazir, S., Ullah, Z., & Khan, S. U. (2021). Analysis of simple K-mean and parallel K-mean clustering for software products and organizational performance using education sector dataset. Scientific programming, 2021(1), 9988318. https://doi.org/10.1155/2021/9988318
- [60] Celebi, M. E., Kingravi, H. A., & Vela, P. A. (2013). A comparative study of efficient initialization methods for the k-means clustering algorithm. Expert systems with applications, 40(1), 200–210. https://doi.org/10.1016/j.eswa.2012.07.021
- [61] Schubert, E., Sander, J., Ester, M., Kriegel, H. P., & Xu, X. (2017). DBSCAN revisited, revisited: why and how you should (still) use DBSCAN. ACM transactions on database systems (tods), 42(3), 1–21. https://doi.org/10.1145/3068335
- [62] Su, Y. Y., & Chang, S. J. (2008). Spatial cluster detection for the fishing vessel monitoring systems [presentation]. OCEANS 2008-mts/ieee kobe techno-ocean (pp. 1–4). https://doi.org/10.1109/OCEANSKOBE.2008.4531048
- [63] Shi, M., Zhao, Y., Yu, W., Chen, Y., & Chi, N. (2019). Enhanced performance of PAM7 MISO underwater VLC system utilizing machine learning algorithm based on DBSCAN. IEEE photonics journal, 11(4), 1–13. https://doi.org/10.1109/JPHOT.2019.2928827
- [64] Hu, X., Liu, L., Qiu, N., Yang, D., & Li, M. (2018). A MapReduce-based improvement algorithm for DBSCAN. Journal of algorithms & computational technology, 12(1), 53–61. https://doi.org/10.1177/1748301817735665
- [65] Natale, F., Gibin, M., Alessandrini, A., Vespe, M., & Paulrud, A. (2015). Mapping fishing effort through AIS data. PloS one, 10(6), e0130746. https://doi.org/10.1371/journal.pone.0130746
- [66] Lai, W., Zhou, M., Hu, F., Bian, K., & Song, Q. (2019). A new DBSCAN parameters determination method based on improved MVO. Ieee access, 7, 104085–104095. https://doi.org/10.1109/ACCESS.2019.2931334
- [67] Kim, J. H., Choi, J. H., Yoo, K. H., & Nasridinov, A. (2019). AA-DBSCAN: an approximate adaptive DBSCAN for finding clusters with varying densities. The journal of supercomputing, 75(1), 142–169. https://doi.org/10.1007/s11227-018-2380-z
- [68] Saaty, T. L. (2008). Decision making with the analytic hierarchy process. International journal of services sciences, 1(1), 83–98. https://doi.org/10.1504/IJSSCI.2008.017590
- [69] Piya, S., Al-Hinai, Y., Al Hinai, N., Khadem, M., & Shamsuzzaman, M. (2025). An integrated multi-criteria decision-making model for identifying complexity drivers in the oil and gas supply chain. Supply chain analytics, 10, 100104. https://doi.org/10.1016/j.sca.2025.100104
- [70] Gupta, S., Soni, U., & Kumar, G. (2019). Green supplier selection using multi-criterion decision making under fuzzy environment: A case study in automotive industry. Computers \& industrial engineering, 136, 663–680. https://doi.org/10.1016/j.cie.2019.07.038
- [71] LASTRA, O. E., Villanueva, L. B., & Morán, A. I. (2022). Neutrosophic Multi-Criteria Method for Selecting Optimum Market. International journal of neutrosophic science (IJNS), 19(1). https://search.ebscohost.com
- [72] Rojas-Gualdrón, R., Lozano-Suarez, L., & Polo-Triana, S. (2025). Neutrosophic model-driven decision support system for international market selection based on Montecarlo simulation and a novel neutrosophic AHP score function. International journal of neutrosophic science (IJNS), 26(2). https://search.ebscohost.com
- [73] Manirathinam, T., Narayanamoorthy, S., Geetha, S., Othman, M. F. I., Alotaibi, B. S., Ahmadian, A., & Kang, D. (2023). Sustainable renewable energy system selection for self-sufficient households using integrated fermatean neutrosophic fuzzy stratified AHP-MARCOS approach. Renewable energy, 218, 119292. https://doi.org/10.1016/j.renene.2023.119292
- [74] Gupta, S., Khanna, R., Kohli, P., Agnihotri, S., Soni, U., & Asjad, M. (2023). Risk evaluation of electric vehicle charging infrastructure using Fuzzy AHP--a case study in India. Operations management research, 16(1), 245–258. https://doi.org/10.1007/s12063-022-00290-8
- [75] Qi, S., Shuai, J., Shi, L., Li, Y., & Zhou, L. (2024). Quantitative risk assessment of leakage accident of crude oil storage tank based on fuzzy Bayesian network and improved AHP. Journal of loss prevention in the process industries, 90, 105341. https://doi.org/10.1016/j.jlp.2024.105341
- [76] Broumi, S., & Smarandache, F. (2013). Several similarity measures of neutrosophic sets. Infinite study, 410(1). https://books.google.nl/books
- [77] Nguyen, P. H., Nguyen, L. A. T., Vu, T. G., Vu, D. M., Nguyen, T. H. T., Le, H. Q., … others. (2025). Mapping barriers to sustainable fashion consumption: insights from neutrosophic-Z Number and Delphi-DEMATEL Integration. Neutrosophic sets and systems, 80, 749–788. https://fs.unm.edu/nss8/index.php/111/article/download/5783/2394
- [78] Cadena, M. A. T., Medina, E. M. P., Burgos, M. J., & Vaca, F. J. (2020). Neutrosophic AHP in the analysis of Business Plan for the company Rioandes bus tours. Neutrosophic sets and systems, 34, 16. https://books.google.nl/books
- [79] Du, S., Ye, J., Yong, R., & Zhang, F. (2021). Some aggregation operators of neutrosophic Z-numbers and their multicriteria decision making method. Complex & intelligent systems, 7(1), 429–438. https://doi.org/10.1007/s40747-020-00204-w
- [80] Gupta, S., Kumar, R., & Kumar, A. (2024). Green hydrogen in India: Prioritization of its potential and viable renewable source. International journal of hydrogen energy, 50, 226–238. https://doi.org/10.1016/j.ijhydene.2023.08.166
- [81] He, S., Xu, H., Zhang, J., & Xue, P. (2023). Risk assessment of oil and gas pipelines hot work based on AHP-FCE. Petroleum, 9(1), 94–100. https://doi.org/10.1016/j.petlm.2022.03.006
- [82] Priya, P., & Venkatesh, A. (2012). Integration of analytic hierarchy process with regression analysis to identify attractive locations for market expansion. Journal of multi-criteria decision analysis, 19(3–4), 143–153. https://doi.org/10.1002/mcda.1471
- [83] Nguyen, P. H., Nguyen, L. A. T., Nguyen, K. A., Nguyen, M. A. N., Nguyen, L. D. T., Nguyen, L. T., & others. (2024). Z-number based fuzzy MCDM models for analyzing non-traditional security threats to finance supply chains: A case study from Vietnam. Heliyon, 10(11). https://www.cell.com/heliyon/fulltext/S2405-8440(24)07646-1
- [84] Haseli, G., Yazdani, M., Shaayesteh, M. T., & Hajiaghaei-Keshteli, M. (2025). Logistic hub location problem under fuzzy Extended Z-numbers to consider the uncertainty and reliable group decision-making. Applied soft computing, 171, 112751. https://doi.org/10.1016/j.asoc.2025.112751
- [85] Abdullah, L., Ong, Z., & Mohd Mahali, S. (2021). Single-Valued Neutrosophic DEMATEL for Segregating Types of Criteria: A Case of Subcontractors’ Selection. Journal of mathematics, 2021(1), 6636029. https://doi.org/10.1155/2021/6636029
- [86] Torfi, F., Farahani, R. Z., & Rezapour, S. (2010). Fuzzy AHP to determine the relative weights of evaluation criteria and Fuzzy TOPSIS to rank the alternatives. Applied soft computing, 10(2), 520–528. https://doi.org/10.1016/j.asoc.2009.08.021
- [87] Khanna, R., Kumar, A., Garg, M. P., Singh, A., & Sharma, N. (2015). Multiple performance characteristics optimization for Al 7075 on electric discharge drilling by Taguchi grey relational theory. Journal of industrial engineering international, 11(4), 459–472. https://doi.org/10.1007/s40092-015-0112-z
- [88] Trang, M. (2024). Current status and solutions for developing Vietnam’s oil and gas industry to 2035, vision to 2045. https://tapchicongthuong.vn/thuc-trang-va-giai-phap-phat-trien-nganh-dau-khi-viet-nam-den-nam-2035-tam-nhin-2045-101663.htm
- [89] Newspaper, G. E. (2024). Türkiye’s Financial Crisis: Beware the Spark. https://baochinhphu.vn/khung-hoang-tai-chinh-tho-nhi-ky-can-than-truoc-dom-lua-nho-102243137.htm
- [90] Release, W. B. P. (2024). World Bank and Türkiye Sign Agreement for $1 billion program to support renewable energy expansion efforts. https://www.worldbank.org/en/news/press-release/2024/05/27/world-bank-and-t-rkiye-sign-agreement-for-1-billion-program-to-support-renewable-energy-expansion-efforts
- [91] Madani, K. (2021). Have international sanctions impacted Iran’s environment? World, 2(2), 231–252. https://doi.org/10.3390/world2020015
- [92] Reuters. (2024). Chevron, Repsol quit oil and gas exploration blocks in Mexican Gulf. https://www.reuters.com/business/energy/chevron-repsol-quit-oil-gas-exploration-blocks-mexican-gulf-2023-09-07
- [93] Beamish, P. W. (1987). Joint ventures in LDCs: Partner selection and performance. Management international review, 23–37. https://www.jstor.org/stable/40227826
- [94] Bartezzaghi, G., Cattani, A., Garrone, P., Melacini, M., & Perego, A. (2022). Food waste causes in fruit and vegetables supply chains. Transportation research procedia, 67, 118–130. https://doi.org/10.1016/j.trpro.2022.12.042
- [95] Luo, N., Olsen, T., Liu, Y., & Zhang, A. (2022). Reducing food loss and waste in supply chain operations. Transportation research part e: logistics and transportation review, 162, 102730. https://doi.org/10.1016/j.tre.2022.102730
- [96] Matharu, M., Gupta, N., & Swarnakar, V. (2022). Efforts are made but food wastage is still going on: a study of motivation factors for food waste reduction among household consumers. Asia-pacific journal of business administration, 14(2), 244–264. https://doi.org/10.1108/APJBA-07-2021-0303
- [97] Filimonau, V., & Delysia, A. (2019). Food waste management in hospitality operations: A critical review. Tourism management, 71, 234–245. https://doi.org/10.1016/j.tourman.2018.10.009
- [98] Wu, Z., Mohammed, A., & Harris, I. (2021). Food waste management in the catering industry: Enablers and interrelationships. Industrial marketing management, 94, 1–18. https://doi.org/10.1016/j.indmarman.2021.01.019
- [99] Ribeiro, A. P., Rok, J., Harmsen, R., Carreón, J. R., & Worrell, E. (2019). Food waste in an alternative food network-A case-study. Resources, conservation and recycling, 149, 210–219. https://doi.org/10.1016/j.resconrec.2019.05.029
- [100] Lebersorger, S., & Schneider, F. (2014). Food loss rates at the food retail, influencing factors and reasons as a basis for waste prevention measures. Waste management, 34(11), 1911–1919. https://doi.org/10.1016/j.wasman.2014.06.013
- [101] Moraes, C., Kerrigan, F., & McCann, R. (2019). Consumer ethical judgement of threat appeals: an abstract. Academy of marketing science world marketing congress (pp. 389-390). Cham: Springer International Publishing. https://doi.org/10.1007/978-3-030-42545-6_127
- [102] Filimonau, V., Todorova, E., Mzembe, A., Sauer, L., & Yankholmes, A. (2020). A comparative study of food waste management in full service restaurants of the United Kingdom and the Netherlands. Journal of cleaner production, 258, 120775. https://doi.org/10.1016/j.jclepro.2020.120775
- [103] Charlebois, S., Creedy, A., & von Massow, M. (2015). “Back of house”--focused study on food waste in fine dining: the case of Delish restaurants. International journal of culture, tourism and hospitality research, 9(3), 278–291. https://doi.org/10.1108/IJCTHR-12-2014-0100
- [104] Filimonau, V., & Todorova, E. (2020). Management of hospitality food waste and the role of consumer behavior. In Food industry wastes (pp. 451–466). Elsevier. https://doi.org/10.1016/B978-0-12-817121-9.00021-8
- [105] Magalhaes, V. S. M., Ferreira, L. M. D. F., & Silva, C. (2021). Causes and mitigation strategies of food loss and waste: a systematic literature review and framework development. Sustainable production and consumption, 28, 1580–1599. https://doi.org/10.1016/j.spc.2021.08.004
- [106] Ali, S. M., Moktadir, M. A., Kabir, G., Chakma, J., Rumi, M. J. U., & Islam, M. T. (2019). Framework for evaluating risks in food supply chain: Implications in food wastage reduction. Journal of cleaner production, 228, 786–800. https://doi.org/10.1016/j.jclepro.2019.04.322
- [107] Magalhaes, V. S. M., Ferreira, L. M. D. F., & Silva, C. (2021). Using a methodological approach to model causes of food loss and waste in fruit and vegetable supply chains. Journal of cleaner production, 283, 124574. https://doi.org/10.1016/j.jclepro.2020.124574
- [108] De Moraes, C. C., de Oliveira Costa, F. H., da Silva, A. L., da Silva César, A., Delai, I., & Pereira, C. R. (2022). Causes and prevention practices of food waste in fruit and vegetable supply chains: How is Brazil dealing with these issues? Waste management, 154, 320–330. https://doi.org/10.1016/j.wasman.2022.10.021
- [109] Gurashi, R. (2017). The Sharing Economy at the Crossroads. A Conflict Between Social Values and Market Mechanisms. European journal of sustainable development, 6(4), 511. https://doi.org/10.14207/ejsd.2017.v6n4p511
- [110] Ban Quan hệ Quốc tế - VCCI (n.d.). Malaysia Market Profile. https://vcci.com.vn/uploads/MALAYSIA_2020.pdf
- [111] Economy, T. G. (2024). Download data: GDP growth, inflation, and other indicators. https://www.theglobaleconomy.com/download-data.php
- [112] Review, V. I. (2024). Vietnamese Oil Facing Significant Hurdles. https://vir.com.vn/vietnamese-oil-facing-significant-hurdles-96108.html
- [113] Duc, M. (2024). Financial leasing market: Effective, with great potential but underdeveloped. https://thitruongtaichinhtiente.vn/thi-truong-cho-thue-tai-chinh-huu-hieu-nhieu-tiem-nang-nhung-chua-phat-trien-49676.html
- [114] Hoang, H. A. (2024). Ten years of the “Belt and Road” Initiative: Current status and prospects. https://www.tapchicongsan.org.vn/web/guest/tin-binh-luan/- /asset_publisher/DLIYi5AJyFzY/content/muoi-nam-sang-kien-vanh-dai-con-duong-thuc-trang-va-trien-vong#
- [115] Christopher, M., Harrison, A., & van Hoek, R. (2016). Creating the agile supply chain: issues and challenges. Developments in logistics and supply chain management: past, present and future, 61–68. https://doi.org/10.1057/9781137541253_6
- [116] Cooper, R. G. (2011). Perspective: The innovation dilemma: How to innovate when the market is mature. Journal of product innovation management, 28(s1), 2–27. https://doi.org/10.1111/j.1540-5885.2011.00858.x
- [117] Ye, J. (2021). Similarity measures based on the generalized distance of neutrosophic Z-number sets and their multi-attribute decision making method. Soft computing, 25(22), 13975–13985. https://doi.org/10.1007/s00500-021-06199-x