
Multi Tier Cooperative Population Search for Continuous Black Box Optimization
Abstract
Structured populations can combine local adaptation, information exchange and global resource allocation. We formulate Multi Tier Cooperative Population Search (MTCPS), which combines four proposal operators, per-deme recent-improvement credits, elite migration and a coordinator that retains elites and redistributes individuals. The revised specification preserves population size, distinguishes population cycles from objective calls and separates changing penalty scores from fixed-objective incumbents. The supplied main table gives MTCPS ten strict minima and two tied minima across twelve displayed cases. However, the aggregate case count, benchmark dimensions, rank sums, correction outputs and two source figures are inconsistent, so the report does not establish verified aggregate superiority. A conditional hitting proposition replaces the unsupported population-convergence argument; it requires explicit sublevel-set coverage and indefinitely continued trials. The contribution is an inspectable combination of population organization and operator allocation, with reported numerical observations preserved for reconstruction rather than certified as independently reproduced
Keywords:Structured population searchAdaptive operator selectionElite migrationEvaluation budgetingConditional convergenceBenchmark interpretation
experiments.
1. Introduction
Continuous black-box optimization seeks low objective values from evaluations of candidate vectors. Genetic algorithms [1], differential evolution [2], particle swarms [3] and covariance adaptation [4] provide different search mechanisms. GWO [5], WOA [6] and HHO [7] supply additional comparator families. Their relevance to a particular case depends on the executed variants and budget; benchmark labels alone do not establish general performance.
Population organization and operator allocation address different design decisions. A flat population can share adaptation information, while an island structure restricts some interactions to demes. Adaptive operator selection [8] allocates trials among proposals, and SHADE [9] adapts successful DE parameters. These mechanisms can already coexist; MTCPS does not identify them as mutually exclusive literatures or universally flat designs.
Migration sizes and intervals have been studied in island models [10]. Hierarchical PSO with automatic parameter configuration [11] supplies a direct precedent for coupling population structure and adaptation. Cooperative coevolution [12] instead partitions decision variables into subcomponents, which differs from splitting complete candidate vectors into demes. Taxonomic work [13] reinforces the need to state a concrete mechanism rather than claim novelty from a new organizational label.
MTCPS combines individual proposals, deme-level credits and migration, and coordinator-level archive maintenance and population redistribution. The source alternates between evaluation-based periods and a generation-loop pseudocode. Here t denotes a population cycle, with migration every τ_m=5 cycles and coordination every τ_a=15 cycles. This resolves the written specification but does not verify the original implementation clock. A separate hard objective-call counter determines the budget.
The methodological increment is this particular coupling of per-deme operator allocation with elite exchange and improvement-based integer resource allocation. We provide a consistent specification and a conditional fixed-objective hitting result. The numerical contribution is the interpretation of the supplied tables and original figures, whose provenance and aggregate statistical inputs remain unresolved. No new campaign or verified public release is asserted.
The paper develops the formulation and its computational costs, states the assumptions needed for an asymptotic result, and then separates descriptive source outcomes from inferential claims. Algorithmic repairs are requirements for checking the executed implementation; they are not records of experiments performed during revision.
2. Background and Related Work
Related work connects proposal adaptation, island migration, cooperative coevolution and algorithm ensembles. These are complementary mechanisms rather than a chronology culminating uniquely in MTCPS. The taxonomy in [13] is used for positioning, without importing an unverified count of new algorithms.
2.1 Single-Population Continuous Metaheuristics
PSO [3] combines personal and social information, DE [2] uses population differences, and CMA-ES [4], [14] adapts a sampling covariance. Their precise variants determine stability and cost. For dense covariance sampling, costs can include O(ND²) transformations and periodic O(D³) factorizations, in addition to evaluation cost. No universal inertia threshold or dimension cutoff follows from these background descriptions.
MTCPS uses vector proposals instead of full dense covariance adaptation. That can reduce some algebraic costs, but does not establish a superior convergence rate or a universally cheaper solver. The comparison must include all tiers, objective costs, restart policies and actual evaluation counts. The reported population N=50 is not asymptotically much smaller than dimensions 30 or 50.
2.2 Adaptive and Self-Adaptive Variants
Adaptive operator selection [8] provides a background for assigning credits to search moves. SHADE [9] adapts successful DE parameters; jSO [15] and adaptive L-SHADE resource-configuration work [16] illustrate additional concrete variants. The MTCPS recurrence below is its own recent-improvement softmax specification, not an exact reproduction of every policy or guarantee in these sources.
2.3 Multi-Level and Island Population Structures
Island migration [10] exchanges information between local populations. Its effects depend on topology, interval, replacement rule and problem. A continuous search with adaptive credits is not automatically a finite-state homogeneous Markov chain. No generic mixing-time formula or proof of the default interval τ_m=5 is claimed.
Hierarchical PSO [11] and cooperative ensembles [17] already coordinate multiple sources of search information. MTCPS adds a specified archive merge and integer size-allocation step to its own proposal loop. Its entropy-based inverse temperature changes allocation probabilities; it is not a repulsive force between particle positions or an implementation of charged swarms.
2.4 Cooperative Coevolution and Modern Hybrid Ensembles
Cooperative coevolution [18] evolves variable subcomponents, whereas MTCPS demes contain complete vectors. Eigen Crossover cooperation [17] combines search engines and provides a related ensemble comparison. These precedents motivate structured coordination without establishing that the present coordinator is the first or that every hybrid improves difficult functions [17-19].
2.5 Research Gap and Positioning
The research question is whether this specific operator-and-deme composition is useful when all search and coordination costs are included. Table 1 supplies a qualitative structural comparison. Its categories describe the named forms only; they neither prove an absence of coordinators in prior work nor establish an experimentally isolated synergy. Categories concern the specified forms and do not establish a universal taxonomy or priority claim.
Table 1. Qualitative organization of representative named methods.
This table is shown in the PDF version of the article.
3. Problem Formulation
We consider the unconstrained continuous minimisation problem
min_{x ∈ Ω ⊆ R^D} f(x), (1)
Let Ω=∏_i[l_i,u_i] be a nonempty bounded box. We assume f is measurable and its infimum f★ on the relevant feasible domain is finite. Compactness alone does not ensure that a discontinuous measurable objective attains its infimum. Clipping enforces box membership, but does not ensure feasibility for additional nonlinear constraints. or possible constrained extensions, the source proposes the following changing penalty score. No constrained benchmark outcomes are supplied here:
F(x, λ) = f(x) + λ · [ Σ_j max(0, g_j(x))^2 + Σ_k h_k(x)^2 ], (2)
The coefficient follows the source update
λ(t+1) = λ(t) · (1 + η · ν_feas(t)), (3)
Here ν_feas is the source label for the fraction of infeasible candidates, and η=0.1 is reported. Eq. (3) increases λ when that fraction is positive and leaves it unchanged when it is zero; it does not decay. Original objective and constraint values must be cached so comparisons use the same current λ. Penalty magnitude alone does not certify feasibility. A constrained extension would retain a separately checked feasible incumbent and report original residuals and tolerances.
The source reports B=10⁵D objective calls per run. This is its chosen budget, not joint compliance with the official CEC 2017 and CEC 2022 protocols [11], [12]. Initialization, all candidate evaluations and any extra proposal or landscape-sampling calls must be counted. Copying already evaluated migrants or archive vectors needs no new call unless the implementation reevaluates them. Development and configuration costs must also be reported separately.
The evaluation question concerns descriptive performance and cost under a defined campaign. A favorable rank is meaningful only after cases, aggregation and budget are reconciled. The specification below does not promise a small constant overhead for every objective or implementation.
4. Proposed Approach
This section supplies a coherent interpretation of the proposed hierarchy. It resolves state ownership, cycle timing, integer allocation and incumbent retention. These changes are mathematical and algorithmic specifications to compare with source code; the reported numerical campaign has not been rerun.
Fig. 1 depicts individuals inside demes linked to a coordinator. State information can flow upward and decisions downward. The source figure also uses evaluation-based timing and a restart label without a complete executed restart rule. Its architecture is therefore an illustration, rather than an execution log or proof of the detailed specification.
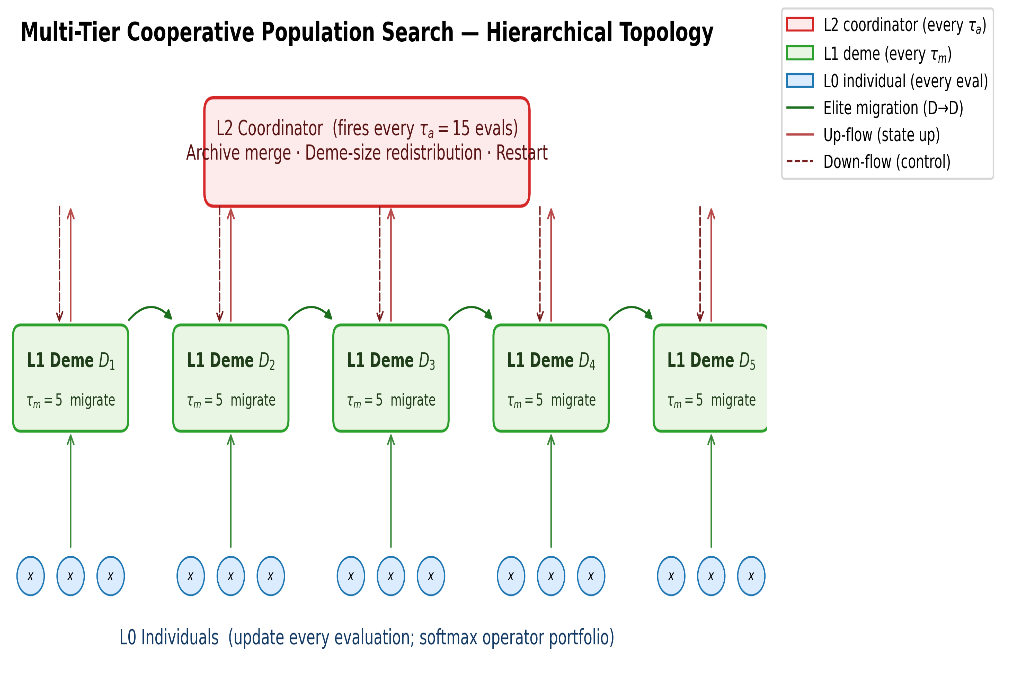
The text uses population-cycle periods to match the loop structure; evaluation-clock labels and the illustrated restart require implementation confirmation.
4.1 Hierarchy Terminology
An individual is an evaluated vector assigned to one deme. Each deme owns an operator-credit vector Q_ℓ, a local elite and an entropy estimate. The coordinator owns a capped archive and integer deme-size vector. A separate scalar best value and associated evaluated vector are retained globally. Unused velocities and personal-best fields are not part of the stated four-operator algorithm.
4.2 The Three Tiers
Partition N vectors into L demes with integer sizes summing to N. Initially distribute floor(N/L) or ceil(N/L) members as needed. The default N=50,L=5 gives ten each; L=3 or L=7 requires unequal balanced sizes rather than copying the rounded nominal size into every deme. Each population cycle attempts the currently assigned members subject to the hard call budget.
At L0, sample from Gaussian mutation, DE/rand/1, random-direction sampling and a heavy-tailed proposal, using the deme credit vector in Eq. (7). The operator definitions require scales, donor selection and crossover details. Ordinary DE/rand/1 needs three distinct donors excluding the parent. Generate, clip and evaluate the offspring; compare it with the parent at the same score coefficients, calculate reward before replacement, then update the selected credit.
At L1, every τ_m cycles each deme exports its evaluated elite to a uniformly chosen different deme. Replace the recipient’s worst member only when the cached same-objective score improves. Migration is disabled for L=1. The actual simultaneous or sequential event order must be recorded, because later exports can otherwise depend on earlier imports.
At L2, every τ_a cycles merge evaluated elites into the archive, retain up to A_max=20 unique vectors in objective order, and calculate nonnegative per-attempt mean improvements s_ℓ over the recent window. Allocate integer sizes using normalized weights w_ℓ=(s_ℓ+ε)/Σ_j(s_j+ε), ε=10⁻⁶, and a constrained rounding problem:
n* = argmin_n Σ_ℓ(n_ℓ−Nw_ℓ)², s. t. Σ_ℓ n_ℓ=N and 4≤n_ℓ≤u_ℓ, n_ℓ integer. (4)
Use u_ℓ=2ceil(N/L), provided 4L≤N≤Σ_ℓu_ℓ. Starting at the lower bounds, repeatedly assign a remaining member to the eligible deme with the smallest marginal increase in the separable quadratic cost; a priority queue gives O(N log L) allocation work.
This preserves total population size, unlike independent floors followed by clipping. Redistribute evaluated members from shrinking demes to growing demes under a stated transfer rule, retaining the best separately before deletion. The execution of this corrected allocation, transfer order and window normalization requires source-code confirmation. Four members support local DE donor selection, rather than proving a sufficient credit-estimation sample.
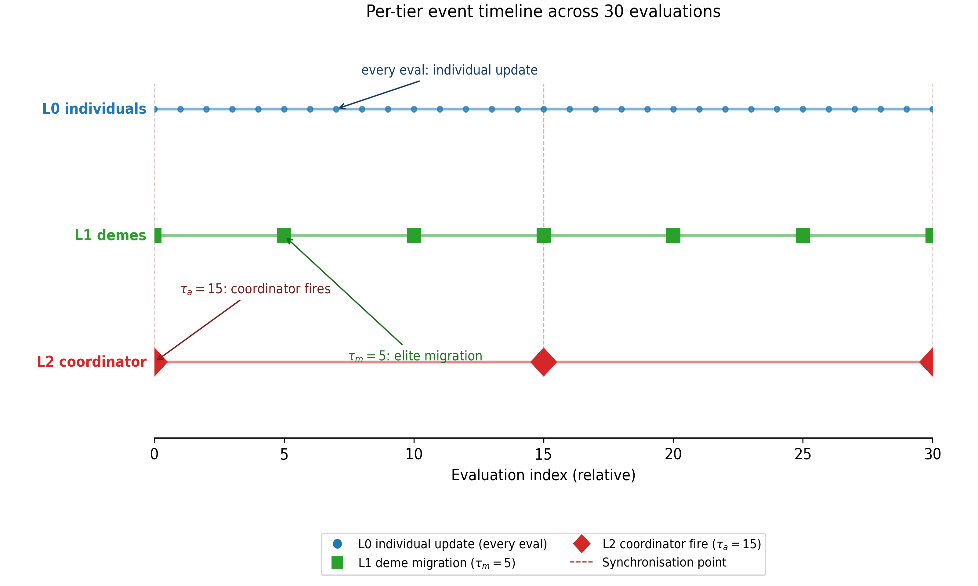
Fig. 2 is the original event illustration over thirty labelled evaluations. The reconstructed loop uses cycles; a cycle can contain up to N proposal evaluations. Those units cannot be interchanged without the original scheduler and call log. At coincident cycle periods, apply migration before the coordinator after local attempts. Budget counters and event logs are required to identify the executed units.
4.3 Per-Tier Operators
Per-deme coordinate-dispersion samples are assigned to a specified ten-bin histogram. Let p_b be bin proportions and define
H_ℓ(t) = − Σ_b p_b · log p_b, (5)
Histogram scaling and bin edges must be fixed or explicitly updated, with empty-bin terms defined as zero. This entropy measures the chosen dispersion summary and does not by itself certify coverage of the search domain. The mean H̄ modulates the source inverse temperature:
α(t) = α_min + (α_max − α_min) · (1 − H̄ (t) / H_max), (6)
H_max=log 10 and α_min=0.2,α_max=2.0 are reported. In Eq. (7), α multiplies credit and is therefore an inverse temperature. Low entropy increases α and concentrates allocation toward higher-credit operators; high entropy lowers α and makes allocation more uniform. This corrects the source’s reversed explanation. Stable evaluation subtracts the maximum logit before exponentiation. For each deme ℓ, select operator k using its current credits:
π_ℓk(t)=exp(α(t)Q_ℓk(t))/Σ_j exp(α(t)Q_ℓj(t)). (7)
For the selected operator only, update
Q_ℓk ← (1−γ)Q_ℓk+γr, (8)
with other components unchanged.
Use r=max{0,F_t(parent)−F_t(offspring)}/(|F_t(parent)|+1), calculated before replacement, and γ=0.2. Unsuccessful attempts contribute zero. This is recent-improvement credit assignment with Boltzmann allocation, not a transferable generic bandit-regret theorem [8]. The reward can exceed one and depends on evolving states and score coefficients; implementation must not broadcast a scalar reward into every credit component.
The source additionally overrides the selected move with a heavy-tailed proposal with probability p_levy=0.1. If this replaces one proposal, the total probability of the heavy-tailed operator is p_levy+(1−p_levy)π_ℓ,levy. If it instead adds a second evaluated proposal, that extra call must be charged. In this specification, an override sets k to the actually applied heavy-tailed operator before its credit update. The interpretation and actual attribution must be confirmed from code.
x′=clip_Ω(x+0.1(u−l)⊙z), z_i=a_i/|b_i|^(1/β), β=1.5. (9)
For this explicit Mantegna-style ratio proposal [20-22], a_i and b_i are independent centered Gaussian draws with standard deviations σ_β and one, respectively, where σ_β={Γ(1+β)sin(πβ/2)/[Γ((1+β)/2)β2^((β−1)/2)]}^(1/β). A zero denominator must be redrawn or otherwise handled by a documented rule. The source’s additional unsigned power-and-subtraction transform is removed. Exact stable-law simulation for the executed sampler is not verified, and clipping changes the proposal distribution. Neither heavy tails nor this construction implies a universal first-passage speedup or attainment of a particular optimum.
Migration reuses evaluated vectors and transfers elite information without a new objective call when scores are cached. It does not guarantee retained diversity or a connected deterministic topology over a particular finite window. Those are separate properties that must be measured or imposed.
The coordinator retains a capped archive. With reported probability κ=0.05 an archive vector can replace a donor in a DE proposal; that is an archive-assisted variant rather than canonical DE/rand/1 and requires donor-uniqueness rules. Eq. (4) uses normalized improvements, not multiplicative weights. As ε tends to zero it remains proportional to positive improvements; it does not generally become follow-the-leader. The finite archive is compatible with retaining one global best scalar and does not need to grow unboundedly.
4.4 Algorithm Pseudocode and Complexity Analysis
Algorithm 1 specifies the consistency requirements. One cycle performs budget-permitted local attempts, then scheduled migration, then coordinator maintenance. All objective calls are counted at their actual location. Cached copies do not create evaluations; initialization is part of the budget.
Algorithm 1. Consistent MTCPS specification.
Input: N,L, hard call budget B, cycle cap T, complete operator and event parameters.
1. Evaluate N box-admissible initial vectors if budget permits; initialize balanced demes, per-deme credits and a retained best.
2. For cycles t=1,…,T while calls remain, calculate the documented entropy and inverse temperature.
3. For each eligible member, sample k; apply the stated heavy-tail override and archive-donor policy, setting k to the actual applied operator.
4. Generate and clip the proposal. Evaluate only when the remaining call budget permits; count every new objective call.
5. Compare parent and offspring at the same objective or current penalty coefficients; calculate pre-replacement reward.
6. Update only Q_ℓk, including zero-improvement attempts, and accept under the stated score rule. Retain the global fixed-objective best separately.
7. At t mod τ_m=0, perform cached elite migration if L>1.
8. At t mod τ_a=0, merge and deduplicate evaluated elites, retain the archive cap and compute per-attempt improvements.
9. Solve the integer allocation (4) and transfer evaluated members according to the documented rule, preserving total N and the retained best.
10. Return the best evaluated vector from all retained incumbents, rather than requiring a nonempty final archive. For a constrained extension, return a directly checked feasible incumbent or an explicit failure status.
Let C_f denote the cost of one objective evaluation. Local work per cycle includes O(NC_f+ND), histogram estimation and O(NK) allocation. A migration event moves L vectors and costs O(LD) besides elite lookup. Archive deduplication can require vector comparisons; a naive pairwise implementation can cost O((L+A_max)²D), while hashing requires an explicit equality policy. Redistribution also moves vectors and maintains assignments. Table 2 gives conditional representative costs, not a cost bound for an unspecified implementation.
Table 2. Representative computational costs per population cycle, amortized over stated cycle periods.
This table is shown in the PDF version of the article.
Objective cost, vector copying and state storage are included; archive deduplication requires an implementation-specific rule. Search cost depends on the objective, operators and implementation. Dense CMA-ES algebra [23] differs from the present proposal mechanism, but relative wall-clock advantage cannot be inferred from an incorrect O(N²D) formula or from N≪D when N=50 and D is 30 or 50. Coordinating more demes may add overhead even when the objective-call count is fixed.
4.5 Conditional Fixed-Objective Hitting
A valid asymptotic statement requires probabilities of reaching objective sublevel sets. Positive operator-selection frequency and communication are insufficient. Assume exact evaluations of one fixed original objective, a finite infimum f★, and retention of the best evaluated objective value independently of archive pruning.
Proposition 1. Let A_ε={x∈Ω:f(x)≤f★+ε}. Suppose for each ε>0 and every proposal trial i, conditional on the entire previous history, the probability that the evaluated feasible proposal belongs to A_ε is at least q_ε>0. After m such trials,
Pr(best_m>f★+ε) ≤ (1−q_ε)^m. (10)
Here best_m is the retained original-objective incumbent. For constrained variants A_ε must be defined on directly checked feasible points, and absence of a feasible incumbent is included in the miss event.
Proof: Conditional expectation bounds the probability of consecutive misses by the product of their conditional miss bounds. A hit is retained by elitism, so failure after m trials requires m misses. If trials continue indefinitely for every ε>0, apply the bound to ε=1/j and take the countable intersection of the probability-one eventual-hit events. The incumbent values then approach f★ almost surely. This argument does not rely on an unbounded archive or a finite-state Markov model. The proposal coverage assumption is not established for the executed MTCPS configuration. Open-ball access need not imply access to measurable objective sublevel sets, and a changing penalty is not one fixed objective. Softmax labels, clipping and a heavy-tailed move do not certify a useful uniform q_ε. The finite budget and stopping rule therefore provide no empirical validation of this infinite-horizon conclusion or a finite optimization rate.
5. Experimental Setup
5.1 Benchmarks and Protocol
The source reports CEC 2017 cases at D=30 and 50 and CEC 2022 at D=10 and 20, yet the headline table labels both suites D=30 and the aggregate analyses use 59 functions. Thirty plus twelve gives forty-two, not fifty-nine, and the modified official CEC 2017 report removes F2 [11]. The official CEC 2022 protocol uses D=10 or 20, thirty runs and respective budgets 200,000 or 1,000,000 [23], the source reports thirty-one runs and B=10⁵D. The actual function–dimension–budget manifest is therefore essential. Errors are interpretable only with the correct function biases, dimensions and reference values.
5.2 Baselines
The comparator labels are PSO, GA, DE, GWO, WOA, HHO, SHADE and CMA-ES [1,2,3,4,5,6,7,9]. Published-implementation claims and the stated BIPOP restart policy need exact repositories, versions and configurations. A common seed list does not establish common initial populations or paired random streams. Report actual calls under the stated stagnation rule; equal maximum budgets do not imply equal stopping counts. jSO [15] is contextual literature, not an additional measured baseline here.
5.3 Statistical Protocol
Problem-block Friedman and Nemenyi comparisons [13], [21] require one identified rank row per independent case. The source n=59 and CD=2.19 are not reconstructed from the available table. Pairwise signed-rank tests require matched case outcomes, zero/tie conventions and an explicit Holm family. A favorable A12 [23] is defined here as probability of a lower MTCPS error plus half the tie probability, under a stated sampling unit. Standardized differences and bootstrap intervals require their outcome arrays, sign convention and resampling units; raw errors from heterogeneous functions should not be pooled without a justified scale. Morris screening [22] requires the parameter ranges and response design. Reported settings are N=50,L=5,M=10,K=4,T=10⁵D/N,α_min=0.2,α_max=2.0,γ=0.2,p_levy=0.1,β=1.5,κ=0.05,τ_m=5,τ_a=15,A _max=20 and η=0.1. Initialization consumes budget in addition to proposal cycles, so T cannot replace a hard counter. The source reports seeds 1001–1031, Python 3.11, NumPy 1.26 and a Xeon Gold 6248R system. These are reported environment details, not independently verified execution provenance.
6. Results and Statistical Analysis
6.1 Overall Performance
In Table 3, MTCPS has ten strict lowest displayed means and two ties with CMA-ES, so it is a minimum on all twelve rows. This corrects the source count of eight. The table remains a selected descriptive subset. Its D=30 CEC 2022 label needs reconciliation and cannot support a conclusion across an unidentified fifty-nine-case campaign.
Table 3. Supplied mean errors for 31 reported runs on twelve selected rows.
This table is shown in the PDF version of the article.
Numerical cells are unchanged. The common D=30 label, especially for CEC 2022, is unresolved and is not official protocol compliance. Table 4’s nine mean ranks sum to 40.00. Standard complete nine-algorithm Friedman ranks must sum to 45.00, including average tie ranks; the discrepancy is too large to be rounding. The values therefore cannot presently be treated as a valid complete rank aggregation. If the reported CD=2.19 is used only as a conditional threshold, the differences for CMA-ES, SHADE and DE do not exceed it; five other differences do.
Table 4. Source-reported rank values and CD-based labels.
This table is shown in the PDF version of the article.
Rank sum and the case manifest are inconsistent; all numeric values are retained pending reconstruction. The original rank plot repeats the unresolved aggregation. Individual bootstrap intervals do not implement the Nemenyi comparison, and nonoverlap is not its criterion. The horizontal marker is also not a verified critical-difference diagram on a common rank axis.
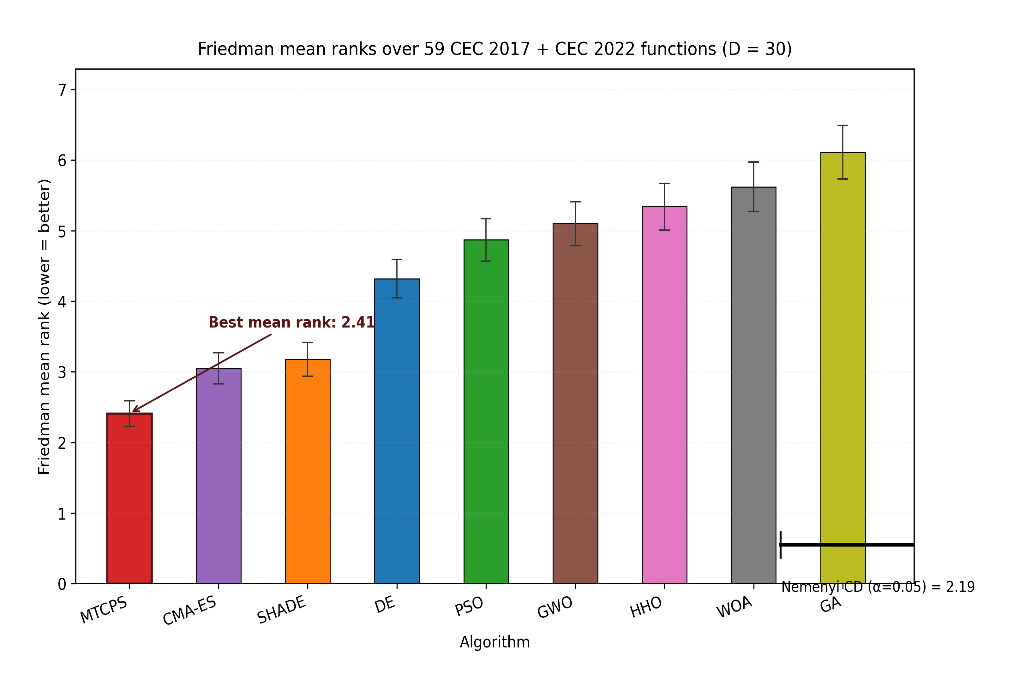
Its case count, aggregate ranks, intervals and CD marker are unverified. Inference uses neither individual interval nonoverlap nor this graphic as a substitute for the rank matrix.
6.2 Pairwise Non-Parametric Tests
Table 5 labels the SHADE contrast significant, contrary to the original prose’s exception. However, its displayed adjusted p-values do not reconstruct Holm correction on the eight displayed raw values: SHADE’s raw 0.018 at the penultimate step would yield at least 0.036, rather than 0.018. The numeric cells are source outputs pending verification. An aggregate signed-rank contrast cannot establish the asserted twenty-seven per-function significant wins.
Table 5. Eight supplied aggregate signed-rank contrasts.
This table is shown in the PDF version of the article.
Numeric outputs are retained; paired units, ties, the case count and Holm reconstruction are unresolved. The CMA-ES decision concerns this contrast rather than the CD criterion.
6.3 Effect Sizes (Vargha-Delaney A12, Hedges g, Cliff δ)
Effect sizes describe a specified distribution or difference [23]. Tables 6 and 7 preserve the source estimates and intervals; positive entries are intended to favor lower MTCPS error and require confirmation of the actual difference direction. A12=0.5 or δ=0 indicates no net ordering advantage, not full distributional equivalence. Standardized g magnitudes and common-language probabilities are different summaries, so they need not receive the same threshold label.
The source A12 values 0.58 for CMA-ES and 0.64 for SHADE are conventionally small and medium descriptions, respectively. SHADE g=0.42 is below the conventional 0.5 medium threshold; DE g=0.78 is below 0.8. Thus the assertion that every weaker comparator has a large standardized effect is overstated. Reported intervals are not reconstructed; an interval spanning the null does not demonstrate equivalence.
Table 6. Source effect sizes and reported 10,000-resample BCa intervals.
This table is shown in the PDF version of the article.
Favorable-direction definitions, outcome scaling and resampling units require verification; the source 59-case label is unresolved.
Table 7. Source A12 estimates and intervals, with descriptive threshold labels [23].
This table is shown in the PDF version of the article.
These intervals do not establish a valid case manifest or equivalence when they include 0.5.
6.4 Convergence Behaviour
Fig. 5 is retained as an unreconciled source trace. Its horizontal endpoint is 10⁵ evaluations while the axis text says 10⁵D at D=30, and the stated run budget is 3×10⁶. The annotated SHADE plateau near error 35 is not shown by its descending orange curve, whose displayed endpoint is higher. Raw traces are required before connecting the curve to Table 3, the claimed interquartile band or the campaign budget.
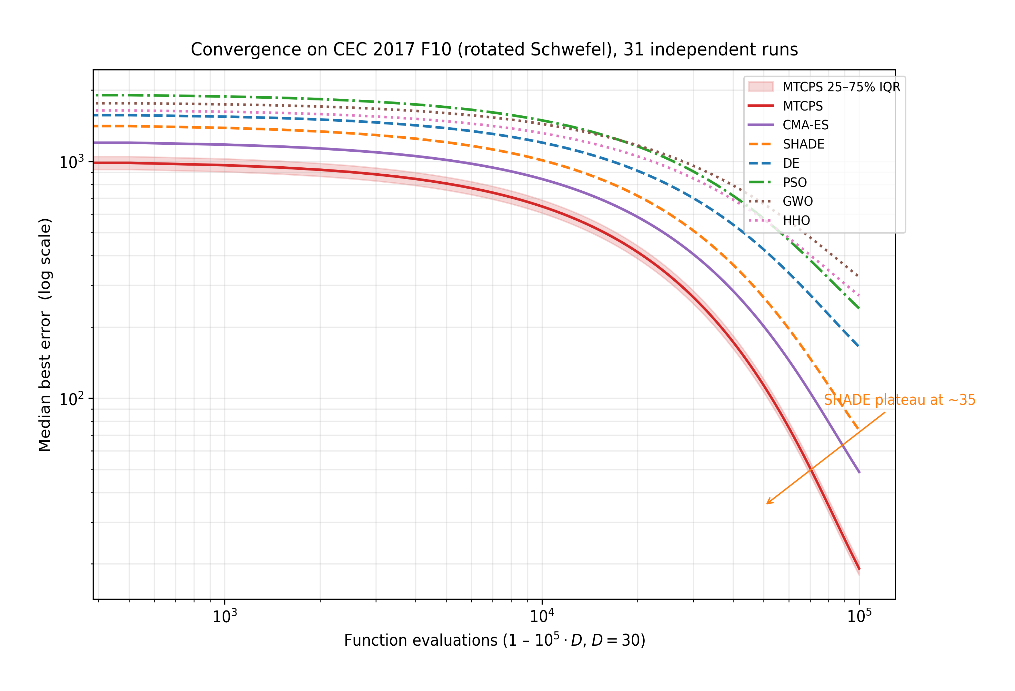
Axis endpoint and budget text disagree, and the SHADE plateau annotation is unsupported by the displayed curve. Median/interval inputs and function mapping require confirmation; no plateau or rate is inferred.
6.5 Per-Function Win/Loss Patterns
Fig. 6 defines green as better than the six-algorithm row median, which is not a strict best-in-row or paired-test win. Its MTCPS column contains five green cells (F1,F2,F10,F13,F28) and twenty-five red cells, contradicting the printed twenty-one-of-thirty headline. The figure also includes the removed CEC 2017 F2. The original graphic is preserved but cannot substantiate that headline or the claimed win/loss pattern.
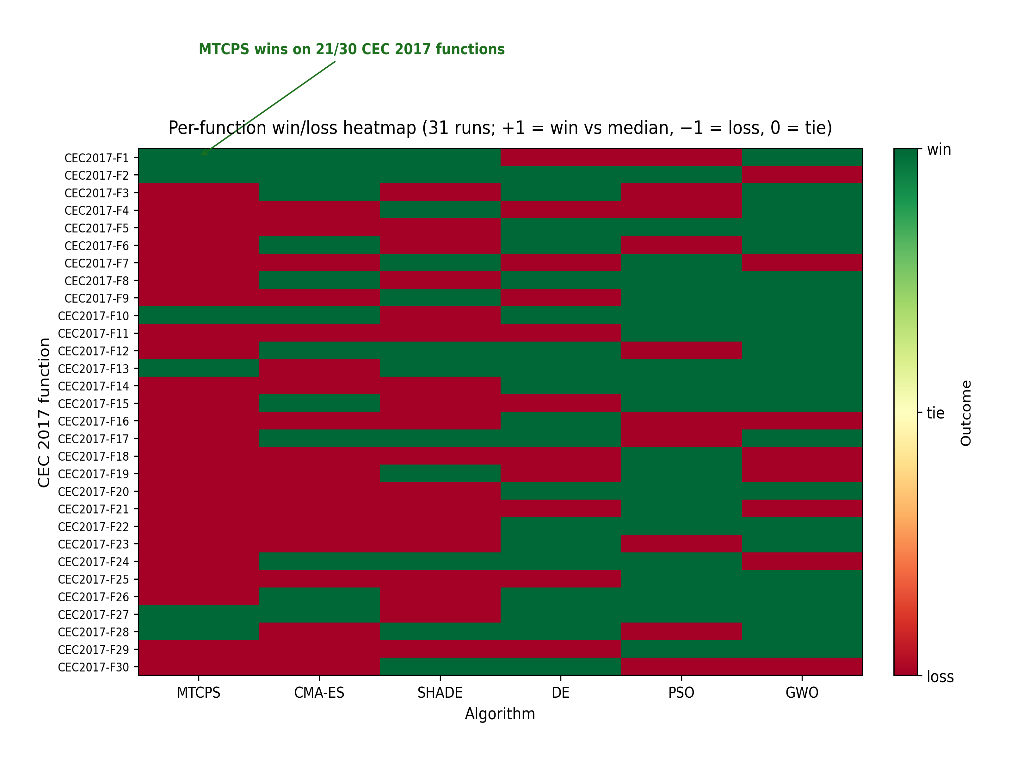
Five displayed MTCPS green cells conflict with its 21/30 headline; signs are not pairwise significance tests. Raw outcomes and plotting logic are required for a corrected figure.
6.6 Sensitivity Analysis (Morris Elementary Effects)
The source reports Morris screening with r=20 trajectories over τ_m,τ_a,A_max,β,p_levy and L. The Lévy index β is distinct from the inverse temperature α, although the source labels it α in the figure and table. Table 8’s mean absolute effects and dispersions and Fig. 7’s multiple responses are preserved as reported estimates. Ranges, normalized steps and repeated-run aggregation are missing.
Table 8. Source Morris elementary effects for a reported aggregate-rank response.
This table is shown in the PDF version of the article.
robust defaults outside the tested ranges.
to every deme.
Σ (Rank) Inference 0.30 Source screening; ranges/response unresolved 0.43 Source screening; ranges/response unresolved 0.17 Source screening; ranges/response unresolved 0.21 Source screening; ranges/response unresolved 0.14 Source screening; ranges/response unresolved 0.34 Source screening; ranges/response unresolved
The case count and design remain unverified. β denotes the Lévy index, called α in the original graphic. Within the displayed figure, the coordinator period has the largest rank-response effect and p_levy the smallest displayed timing effect. Those are relative to a particular unknown design and scale, not evidence of negligible absolute runtime cost. Table 8 and the figure use different response aggregations that must be identified. Large elementary-effect dispersion can indicate nonlinearity or interaction [21], [25] without separating them. Ratios such as 0.43/0.58≈0.74 and 0.34/0.45≈0.76 do not identify a specific L×τ_a interaction. No universal 0.5 threshold or safe one-dimensional line search follows. Low sampled mean effects also do not certify
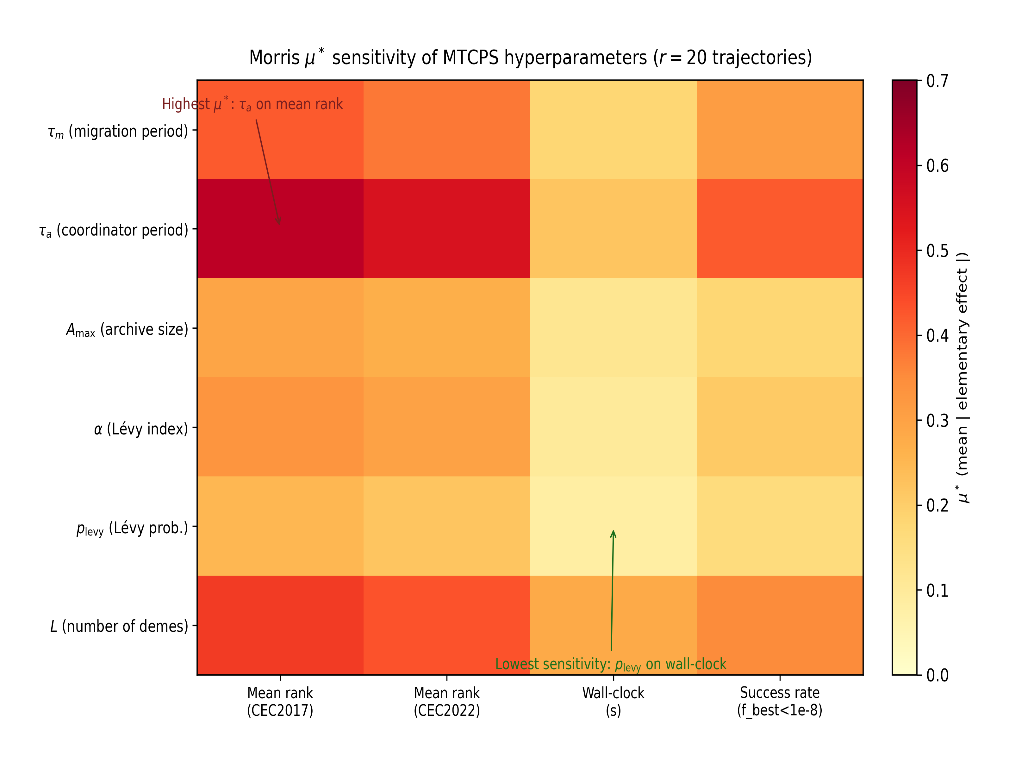
The source α label means Lévy index β here. Parameter ranges, normalized design and response arrays are required to verify its estimates; it does not certify robust tuning.
6.7 Ablation over L ∈ {1, 3, 5, 7}
Table 9’s lowest displayed rank is at L=5. The L=1 difference 0.69 is below, not above, the stated CD=2.19; its significance label is corrected conditionally. Changing L also changes deme sizes, migration availability and coordination opportunities, so this is not an isolated coordinator ablation. It cannot attribute half the improvement to L2. Rounded nominal M values for L=3 and 7 do not each preserve N=50 when assigned
Table 9. Source L-configuration summaries and intervals.
This table is shown in the PDF version of the article.
6.8 Exploratory Landscape Analysis
The source reports a 1,000-point Latin-hypercube sample for landscape analysis. Deep-Exploratory Landscape Analysis (ELA) [19] concerns learned representations and is relevant background, not verification of the classical feature implementation here. Sampling costs, feature definitions and regression inputs must be disclosed. Reported subgroup shifts and a 22% composition-function reduction are not derivable from the supplied main subset and remain unverified source statements.
The reported rank regression gives R²=0.41, dispersion coefficient +0.31 (p<0.01) and metamodel-R² coefficient −0.18 (p=0.04), at stated n=30. Since lower ranks are better, the positive coefficient means higher dispersion is associated with worse MTCPS rank, while the negative coefficient associates greater model fit with better MTCPS rank. The original prose reverses both directions. These conditional associations are not evidence of causation, out-of-sample prediction or CMA-ES advantage. Feature selection, multiple testing and inclusion of the removed F2 require clarification.
7. Discussion
The strongest direct numerical observation is the selected main table’s favorable ordering. Aggregate superiority is not established because the case count, rank sum and correction outputs are inconsistent. A coherent implementation and a reconstructable rank matrix are prerequisites for the broader empirical claim. The coordinator is a meaningful design element, but the L comparison changes several mechanisms at once. Morris screening can suggest sensitivity within specified ranges; it does not assign a causal share of performance. Hierarchical and cooperative precedents [16], [17] motivate comparison without validating the current attribution.
The source feature-regression signs do not support the stated multimodal-advantage narrative, and the median-relative heatmap contradicts its own headline. A problem-class conclusion needs identified classes, their outcome arrays and an appropriately defined comparison. No universal unimodal covariance-method advantage or rate is inferred here.
MTCPS pays for entropy summaries, operator probabilities, elite lookup, copying, archive equality checks and allocation. Objective evaluation cost can dominate those costs, but that must be measured. For cheap functions the full hierarchy may be material, especially as L, N or archive size increases.
The design is modular in the sense that specified proposal mechanisms can be replaced. That flexibility does not make their costs, probabilities or guarantees transferable automatically. A future jSO-inspired portfolio [15] would require its own credit, state and budget specification and a separate campaign.
8. Threats to Validity and Counterarguments
8.1 Hyperparameter Count
The defaults add several controls beyond population size and proposal parameters. The sensitivity results cannot establish that the remaining controls are robust without known ranges and responses. Development searches and baseline configuration costs must be disclosed, and the same test cases should not be represented as independent validation if they selected defaults.
8.2 Theoretical Guarantee
The proposition requires fixed-objective elitism and a uniform conditional sublevel-hit bound. A capped archive can coexist with that retention, but the actual operators do not establish the bound. Infinite continuation also differs from the finite implemented stopping rule. The theorem is therefore a conditional mathematical statement rather than an execution or convergence certificate.
8.3 Benchmark Scope
The original protocol inconsistently labels dimensions and total cases. A complete manifest is required before any aggregate benchmark scope is asserted. Further dimensions, alternative benchmark suites and engineering evaluations would be new work; the cited learned ELA representation [19] is not itself a BBOB/COCO evaluation campaign.
8.4 Wall-Clock Cost
The source reports MTCPS timing ratios 1.27 relative to SHADE and 0.92 relative to CMA-ES on F10. These are retained as unverified timing statements. Hardware, interpreter, restart configuration, actual calls and all hierarchy costs must be matched. The conditional complexity discussion does not certify these ratios or generalize them to other objectives.
8.5 Reproducibility
The implementation, parameter files and raw outcomes are not verified in the supplied materials. The placeholder DOI is not an accessible release identifier. Table 10 records source-reported environment details and unresolved entries; it is a reconstruction checklist rather than a complete reproducibility certificate. Authors must provide the original call/event logs, code, case manifest, statistics and plotting inputs before empirical publication claims are finalized.
Table 10. Source-reported environment and unresolved reconstruction requirements.
This table is shown in the PDF version of the article.
Numbers are preserved; the archive identifier is a placeholder, not a verified public deposit.
9. Conclusion and Future Work
MTCPS combines deme-level operator credits, elite migration and coordinator allocation. The corrected specification preserves population size and makes call accounting and incumbent retention explicit. Its asymptotic result is conditional on sublevel coverage, not established by the finite source experiment. Ten strict and two tied minima in the selected table motivate reconstruction and further testing, while inconsistent aggregate outputs and graphics prevent certified superiority or attribution to one tier.
The next step is to reconstruct the existing implementation and campaign with a fixed manifest, complete call accounting and raw statistical inputs. Independent budgets and a coordinator-only ablation would then test the intended increment. Constrained, multi-objective and learned-policy extensions require separate feasibility, archive and coverage definitions; learning operator labels alone does not construct the proposition’s required probabilities.
Conflict of Interest
The authors certify that they have no affiliations with or involvement in any organization or entity with any financial or non-financial interest in the subject matter discussed in this manuscript.
Data Availability
All data relevant to this study are contained within the manuscript. Additional information is available from the corresponding author upon reasonable request.
Funding
The authors received no financial support for the research, authorship, and/or publication of this article. This work was completed without external funding.
References
- [1] Holland, J. H. (1992). Adaptation in natural and artificial systems: An introductory analysis with applications to biology, control, and artificial intelligence. MIT Press. https://doi.org/10.7551/mitpress/1090.001.0001
- [2] Storn, R., & Price, K. (1997). Differential evolution – a simple and efficient heuristic for global optimization over continuous spaces. Journal of global optimization, 11(4), 341–359. https://doi.org/10.1023/a:1008202821328
- [3] Kennedy, J., & Eberhart, R. (1995, November). Particle swarm optimization. Proceedings of ICNN'95-international conference on neural networks (pp. 1942-1948). IEEE. https://doi.org/10.1109/icnn.1995.488968
- [4] Hansen, N. (2006). The CMA Evolution Strategy: A Comparing Review. In Towards a New Evolutionary Computation (pp. 75–102). Springer, Berlin, Heidelberg. https://doi.org/10.1007/3-540-32494-1_4
- [5] Mirjalili, S., Mirjalili, S. M., & Lewis, A. (2014). Grey wolf optimizer. Advances in engineering software, 69, 46-61. https://doi.org/10.1016/j.advengsoft.2013.12.007
- [6] Mirjalili, S., & Lewis, A. (2016). The whale optimization algorithm. Advances in engineering software, 95, 51-67. https://doi.org/10.1016/j.advengsoft.2016.01.008
- [7] Heidari, A. A., Mirjalili, S., Faris, H., Aljarah, I., Mafarja, M., & Chen, H. (2019). Harris hawks optimization: Algorithm and applications. Future generation computer systems, 97, 849-872. https://doi.org/10.1016/j.future.2019.02.028
- [8] Fialho, Á., Da Costa, L., Schoenauer, M., Sebag, M. (2010). Analyzing bandit-based adaptive operator selection mechanisms. Annals of mathematics and artificial intelligence, 60(1-2), 25–64. https://doi.org/10.1007/s10472-010-9213-y
- [9] Tanabe, R., & Fukunaga, A. (2013). Success-history based parameter adaptation for differential evolution. In 2013 IEEE congress on evolutionary computation (pp. 71-78). IEEE. https://doi.org/10.1109/cec.2013.6557555
- [10] Skolicki, Z., & De Jong, K. (2005, June). The influence of migration sizes and intervals on island models. In Proceedings of the 7th annual conference on Genetic and evolutionary computation (pp. 1295-1302). Association for Computing Machinery. https://doi.org/10.1145/1068009.1068219
- [11] Zhao, F., Ji, F., Xu, T., & Zhu, N. (2024). Hierarchical parallel search with automatic parameter configuration for particle swarm optimization. Applied Soft Computing, 151, 111126. https://doi.org/10.1016/j.asoc.2023.111126
- [12] Potter, M. A., & De Jong, K. A. (1994). A cooperative coevolutionary approach to function optimization. In International conference on parallel problem solving from nature (pp. 249-257). Berlin, Heidelberg: Springer Berlin Heidelberg. https://doi.org/10.1007/3-540-58484-6_269
- [13] Soto Calvo, M., & Lee, H. S. (2025). Systematic taxonomic framework of metaheuristic algorithms using hierarchical clustering and structural criteria: how novel is the novelty?. Artificial intelligence review, 59(2), 61. https://doi.org/10.1007/s10462-025-11456-8
- [14] Hansen, N., Müller, S. D., & Koumoutsakos, P. (2003). Reducing the time complexity of the derandomized evolution strategy with covariance matrix adaptation (CMA-ES). Evolutionary computation, 11(1), 1-18. https://doi.org/10.1162/106365603321828970
- [15] Brest, J., Maučec, M. S., & Bošković, B. (2017). Single objective real-parameter optimization: Algorithm jSO. In 2017 IEEE congress on evolutionary computation (CEC) (pp. 1311-1318). IEEE. https://doi.org/10.1109/cec.2017.7969456
- [16] Li, Y., Han, T., Zhou, H., Tang, S., & Zhao, H. (2022). A novel adaptive L-SHADE algorithm and its application in UAV swarm resource configuration problem. Information sciences, 606, 350-367. https://doi.org/10.1016/j.ins.2022.05.058
- [17] Bujok, P., & Kolenovsky, P. (2022). Eigen crossover in cooperative model of evolutionary algorithms applied to CEC 2022 single objective numerical optimisation. In 2022 IEEE congress on evolutionary computation (CEC) (pp. 1- 8). IEEE. https://doi.org/10.1109/cec55065.2022.9870433
- [18] Kumar, A., Price, K. V., Mohamed, A. W., Hadi, A. A., & Suganthan, P. N. (2021). Problem definitions and evaluation criteria for the CEC 2022 special session and competition on single objective bound constrained numerical optimization. https://github.com/P-N-Suganthan/2022-SO-BO
- [19] Derrac, J., García, S., Molina, D., Herrera, F. (2011). A practical tutorial on the use of nonparametric statistical tests as a methodology for comparing evolutionary and swarm intelligence algorithms. Swarm and evolutionary computation, 1(1), 3–18. https://doi.org/10.1016/j.swevo.2011.02.002
- [20] Mantegna, R. N. (1994). Fast, accurate algorithm for numerical simulation of Levy stable stochastic processes. Physical review E, 49(5), 4677. https://doi.org/10.1103/physreve.49.4677
- [21] Morris, M. D. (1991). Factorial sampling plans for preliminary computational experiments. Technometrics, 33(2), 161–174. https://doi.org/10.1080/00401706.1991.10484804
- [22] Demšar, J. (2006). Statistical comparisons of classifiers over multiple data sets. Journal of machine learning research, 7, 1–30. https://doi.org/10.5555/1248547.1248548
- [23] Vargha, A., Delaney, H. D. (2000). A critique and improvement of the CL common language effect size statistics of McGraw and Wong. Journal of educational and behavioral statistics, 25(2), 101–132. https://doi.org/10.3102/10769986025002101
- [24] Wu, G., Mallipeddi, R., & Suganthan, P. N. (2017). Problem definitions and evaluation criteria for the CEC 2017 competition on constrained real-parameter optimization. https://github.com/P-N-Suganthan/CEC2017-BoundContrained
- [25] Paleari, L., Movedi, E., Zoli, M., Burato, A., Cecconi, I., Errahouly, J., ... & Confalonieri, R. (2021). Sensitivity analysis using Morris: Just screening or an effective ranking method?. Ecological modelling, 455, 109648. https://doi.org/10.1016/j.ecolmodel.2021.109648